AI Electricity Demand Forecasts: Every Published Estimate
Published November 12, 2026
Every answer from ChatGPT, Gemini, or Claude is computed on servers in data centers, and those buildings now use a measurable share of America's electricity. Utilities and grid operators have to plan power plants and transmission lines years before a new data center switches on, so federal labs, energy agencies, banks, and research firms all publish forecasts of how much more electricity data centers will need. Those forecasts differ by hundreds of terawatt-hours, and most of them were raised in the past year, so we put them side by side.
Our analysts collected the forecasts and reported actuals for data center electricity use published by federal labs, the International Energy Agency (IEA), the US Energy Information Administration (EIA), grid operators, utilities, banks, and research firms from April 2024 to November 11, 2026. We recorded each figure with its publisher, publication date, scenario, target year, and geography, and checked it against the original report, table, or release. That gave 46 dated entries, which we grouped by what they measure: annual electricity use in terawatt-hours, share of total electricity, and capacity or peak load in gigawatts.
In the following sections, we compare US forecasts for 2030, data centers' share of US electricity, global forecasts, capacity forecasts in gigawatts, how the forecasts have been revised, grid operator and utility outlooks, US electricity sales by sector, and what Google, OpenAI, and Anthropic disclose about the electricity behind Gemini, ChatGPT, and Claude.
Key Findings
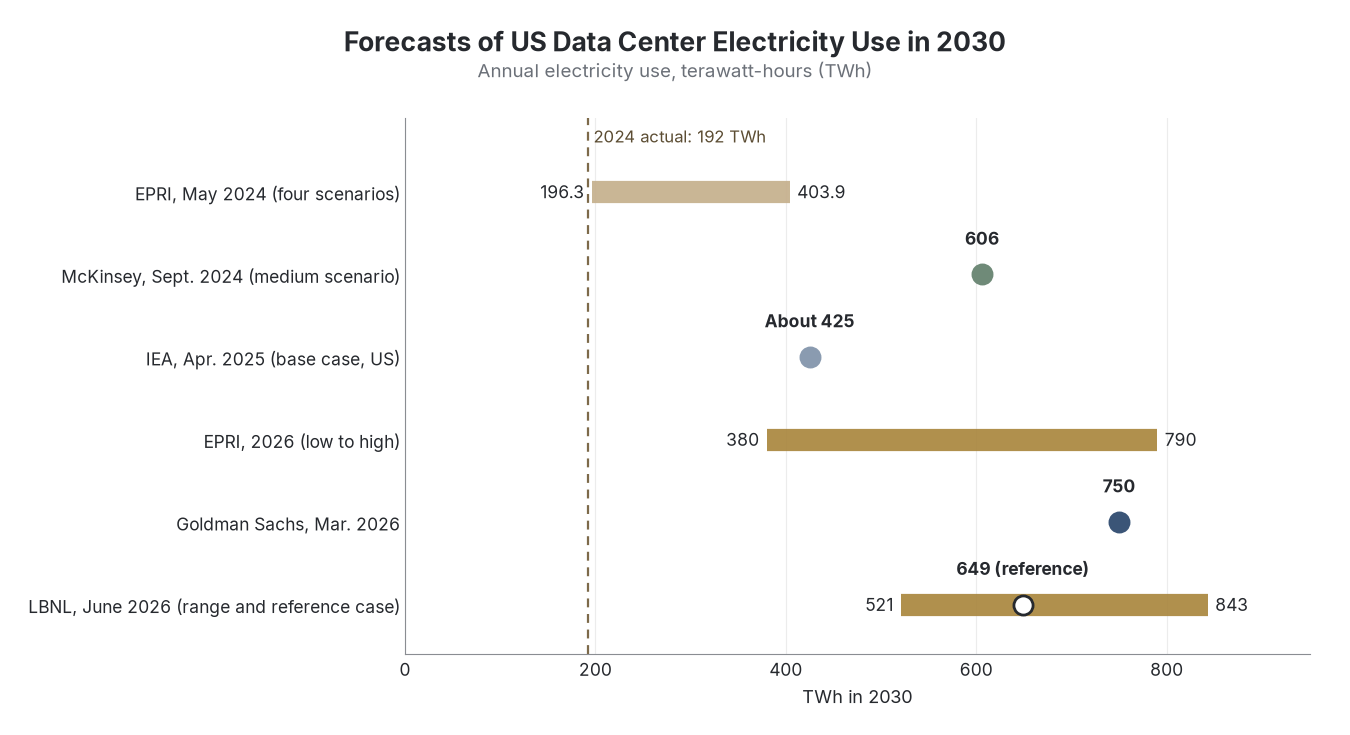
- US data centers used 192 TWh of electricity in 2024, 4.7% of the national total. Forecasts published in 2026 put 2030 use between 380 TWh and 843 TWh, or 2.0 to 4.4 times the 2024 level.
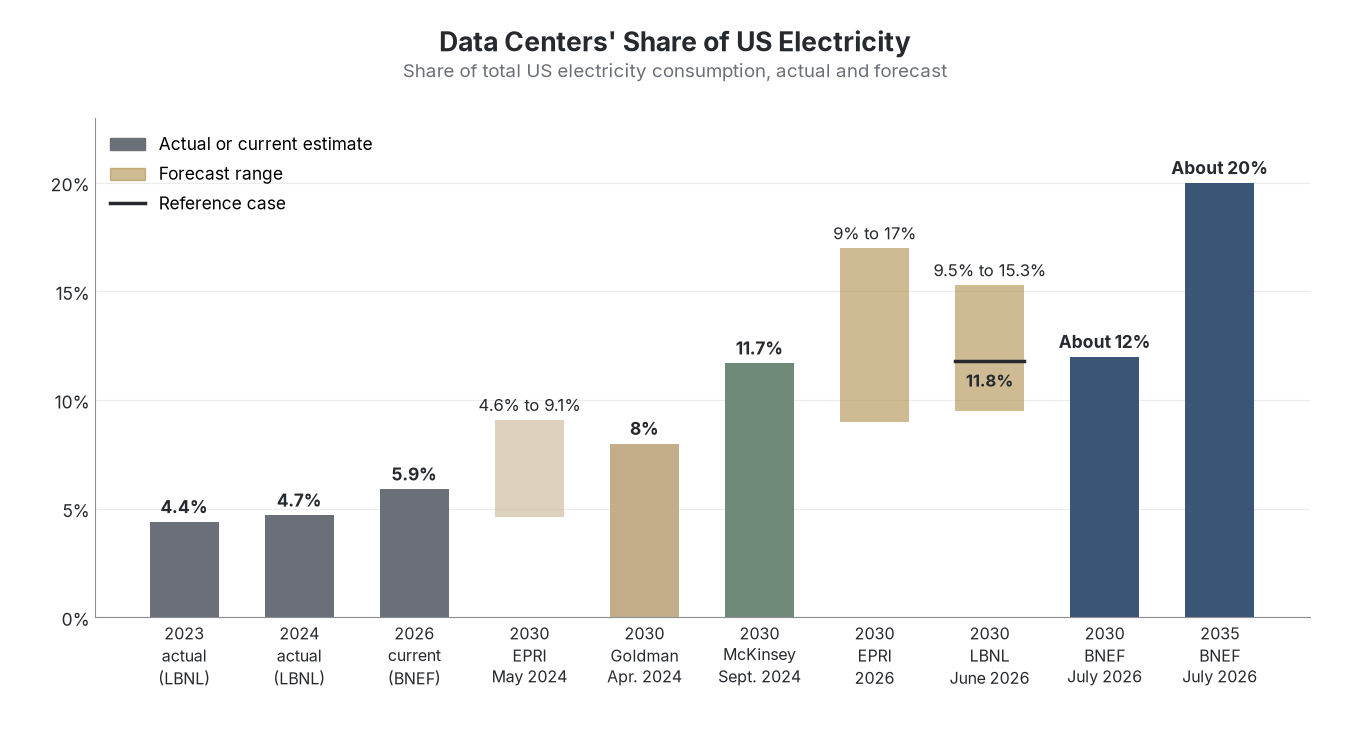
- The three forecasts of data centers' share of US electricity published in 2026 range from 9% to 17% for 2030, and the two that give a central estimate put it near 12%: 11.8% from Lawrence Berkeley National Laboratory and about 12% from BloombergNEF. BloombergNEF puts 2035 at about 20%.
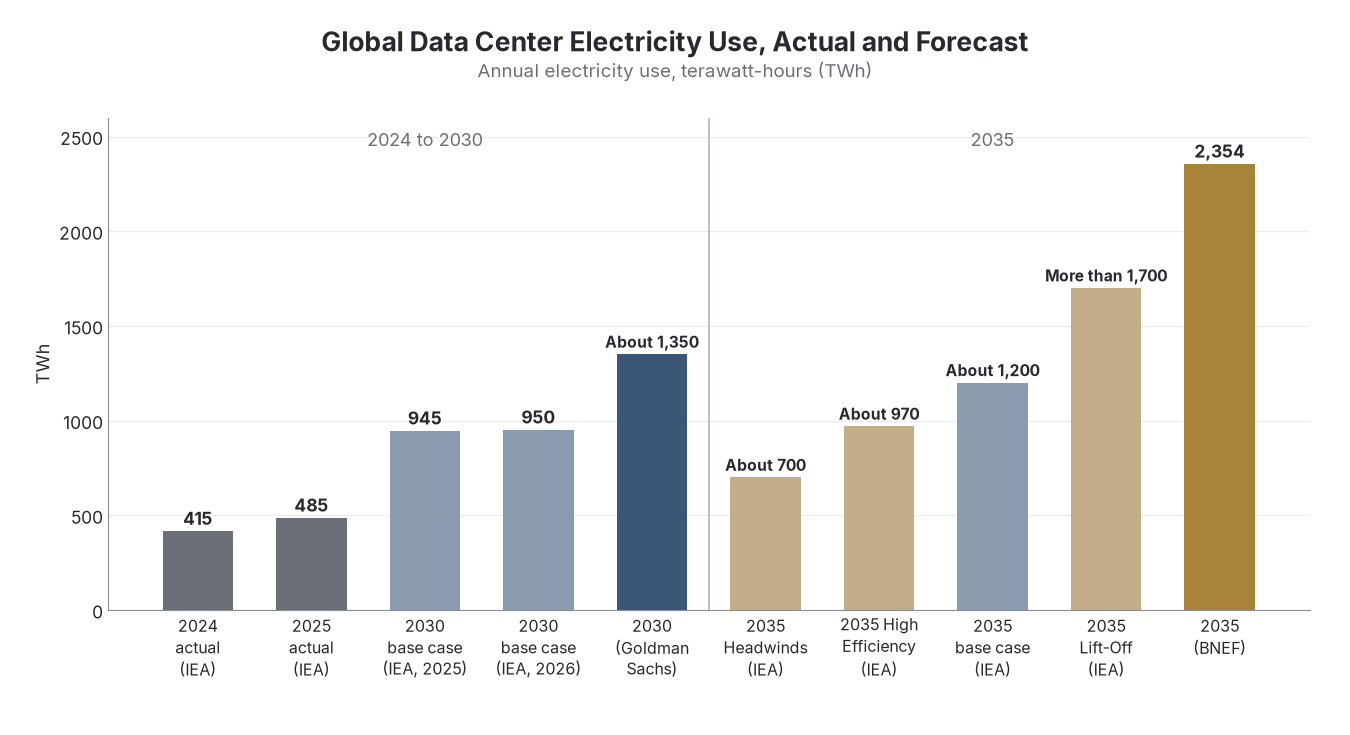
- Worldwide, data centers used 485 TWh in 2025, 17% more than in 2024, and the IEA's base case reaches 950 TWh in 2030. Electricity use in AI-focused data centers rose 50% in 2025 and triples by 2030 in the same outlook.
- Most forecasters raised their numbers within a year. The low and high ends of EPRI's 2030 range nearly doubled, BloombergNEF's 2035 US capacity forecast by 83%, and S&P Global's 2030 grid power forecast by 56%, while the IEA moved its 2030 global figure from 945 TWh to 950 TWh.
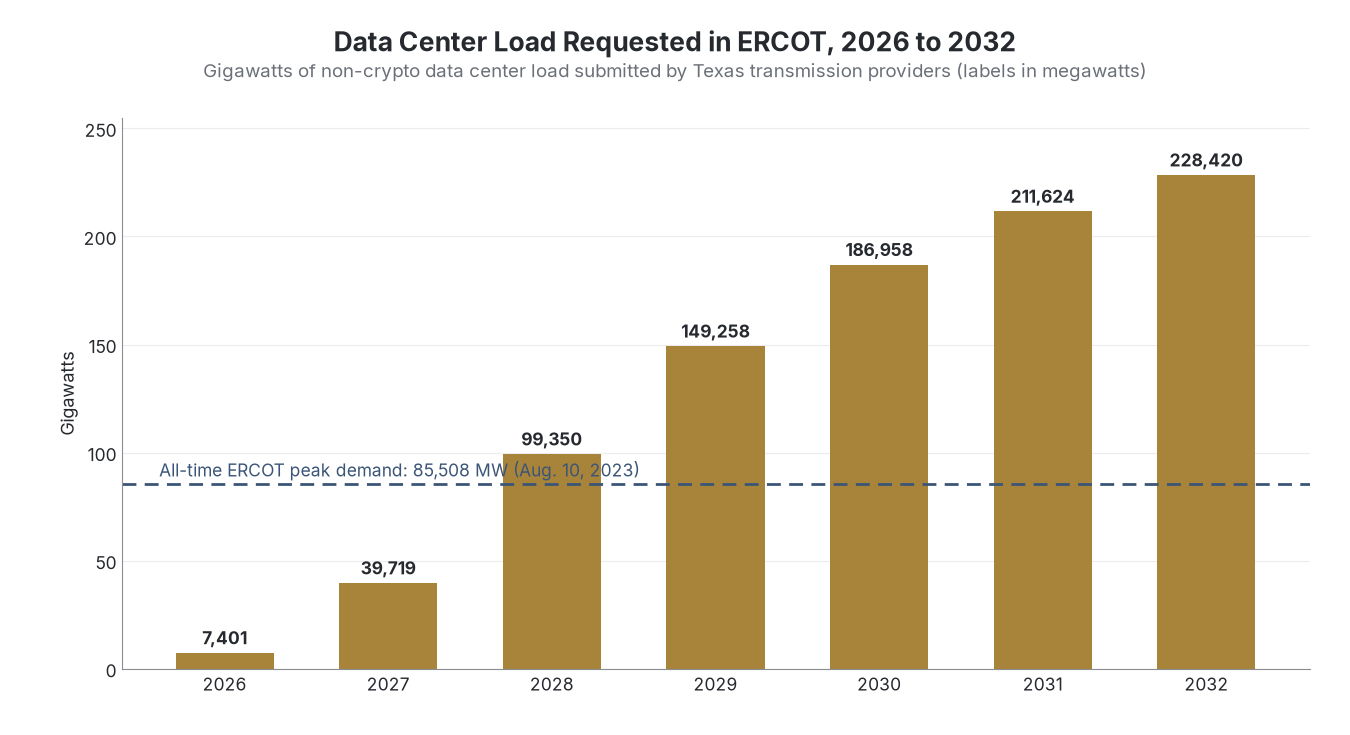
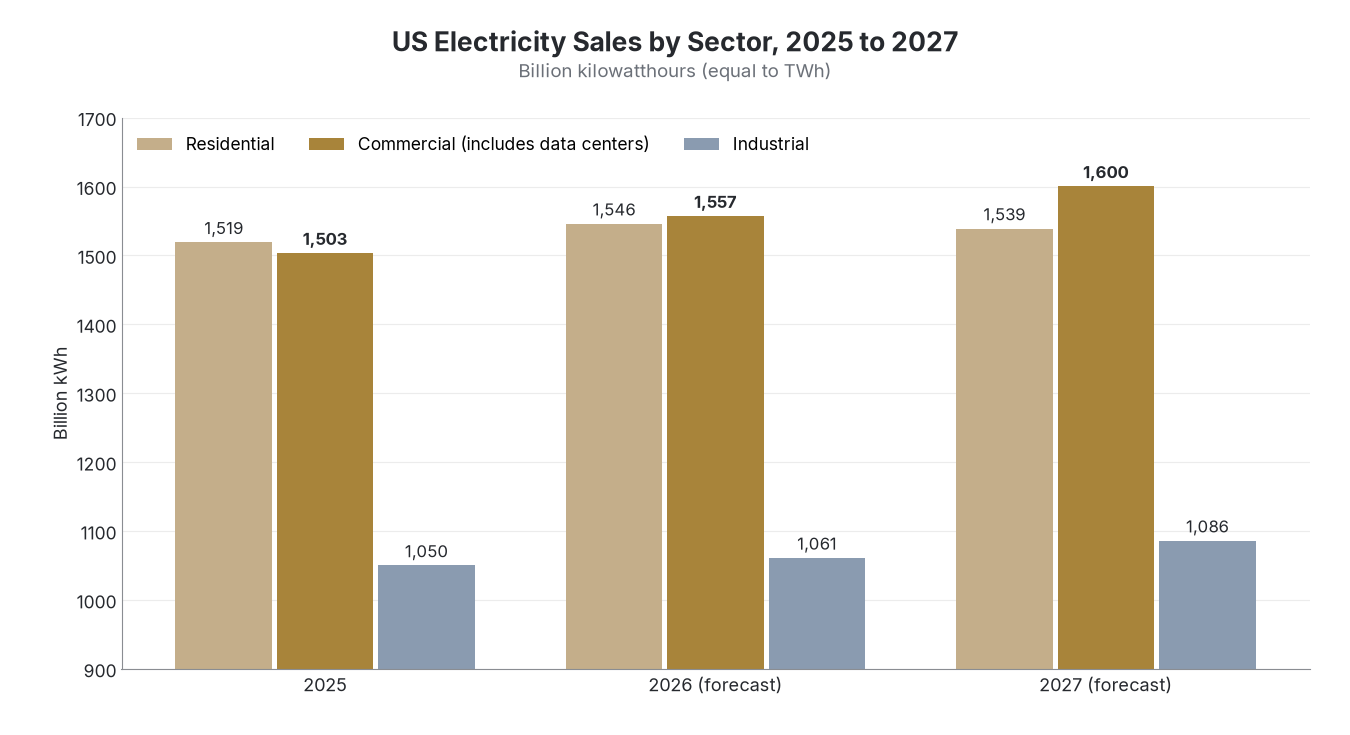
- Texas transmission providers have submitted 228,420 MW of data center load for 2032 to ERCOT, 2.7 times the Texas grid's all-time peak of 85,508 MW. In the EIA's November 2026 outlook, commercial electricity sales, which include data centers, pass residential sales in 2026 at 1,557 billion kWh.
US Data Center Electricity Use: Actuals and 2030 Forecasts
This section lists every estimate of US data center electricity use in terawatt-hours (TWh) that we found, both measured years and forecasts. One TWh is a billion kilowatt-hours, about what 95,000 average US homes use in a year. Most forecasters give a range of scenarios rather than one number, and the table keeps each range as published.
| Publisher | Published | Scenario | Year | Electricity use | Share of US electricity |
|---|---|---|---|---|---|
| LBNL | Dec. 2024 | Estimate | 2023 | 176 TWh | 4.4% |
| LBNL | Dec. 2024 | Low to high scenarios | 2028 | 325 to 580 TWh | 6.7% to 12.0% |
| LBNL | June 2026 | Estimate | 2024 | 192 TWh | 4.7% |
| LBNL | June 2026 | Reference case | 2028 | 464 TWh | Not stated |
| LBNL | June 2026 | Reference case | 2030 | 649 TWh | 11.8% |
| LBNL | June 2026 | Compounded uncertainty, low to high | 2030 | 521 to 843 TWh | 9.5% to 15.3% |
| EPRI | May 2024 | Four growth scenarios, low to high | 2030 | 196.3 to 403.9 TWh | 4.6% to 9.1% |
| EPRI | 2026 | Estimate | 2024 | 177 to 192 TWh | 4% to 5% |
| EPRI | 2026 | Low to high scenarios | 2030 | 380 to 790 TWh | 9% to 17% |
| McKinsey | Sept. 2024 | Medium scenario | 2026 | 292 TWh | 6.5% |
| McKinsey | Sept. 2024 | Medium scenario | 2030 | 606 TWh | 11.7% |
| IEA | Apr. 2025 | Base case (US 45% of global) | 2024 | About 187 TWh | Not stated |
| IEA | Apr. 2025 | Base case (2024 plus about 240 TWh) | 2030 | About 425 TWh | Not stated |
| Goldman Sachs | Mar. 2026 | Base case | 2030 | About 750 TWh | Not stated |
- The two measured estimates for 2024 agree closely: 192 TWh from Lawrence Berkeley National Laboratory (LBNL) and 177 to 192 TWh from EPRI. The 2030 forecasts are far apart, from 196.3 TWh in EPRI's lowest 2024 scenario to 843 TWh in LBNL's highest 2026 scenario.
- The newest forecasts start from different evidence. LBNL models shipments of AI chips and servers, while EPRI counts data center projects under construction and in planning, and the two still overlap between 521 TWh and 790 TWh for 2030.
- LBNL's 2026 reference case of 649 TWh for 2030 is 3.4 times the 2024 level. That growth would make data centers responsible for 33% of all US load growth from 2024 to 2030 under the NERC forecast LBNL uses for total demand.
Data Centers' Share of US Electricity
Share of total electricity puts data center use in context against every other use of power on the grid. This section shows each share estimate, then McKinsey's year-by-year path, which is the only published forecast we found that gives a value for every year from 2023 to 2030.
| Year | Electricity use | Share of US electricity |
|---|---|---|
| 2023 | 147 TWh | 3.7% |
| 2024 | 178 TWh | 4.3% |
| 2025 | 224 TWh | 5.2% |
| 2026 | 292 TWh | 6.5% |
| 2027 | 371 TWh | 8.0% |
| 2028 | 450 TWh | 9.3% |
| 2029 | 513 TWh | 10.3% |
| 2030 | 606 TWh | 11.7% |
- Forecasts published in 2024 put the 2030 share between 4.6% and 11.7%. Forecasts published in 2026 put it between 9% and 17%, so the lowest 2026 estimate is close to the middle of the 2024 range.
- Virginia is the only state where data centers use more than 20% of electricity, and EPRI's 2026 scenarios put Virginia's share at 39% to 57% by 2030. In EPRI's medium scenario, seven more states pass 20%.
- At those levels, the US would use more electricity for data centers by 2030 than for producing aluminum, steel, cement, chemicals, and all other energy-intensive goods combined, a comparison the IEA made in its 2025 base case.
Global Data Center Electricity Forecasts
Outside the US, the IEA is the main source of measured and forecast data center electricity use, and it publishes several scenarios for 2035. This section sets the IEA's figures beside the global forecasts from Goldman Sachs and BloombergNEF.
| Publisher | Published | Scenario | Year | Electricity use or growth | Share of global electricity |
|---|---|---|---|---|---|
| IEA | Apr. 2025 | Estimate | 2024 | 415 TWh | About 1.5% |
| IEA | Apr. 2025 | Base case | 2030 | 945 TWh | Just under 3% |
| IEA | Apr. 2025 | Base case | 2035 | About 1,200 TWh | Not stated |
| IEA | Apr. 2025 | Lift-Off case | 2035 | More than 1,700 TWh | About 4.4% |
| IEA | Apr. 2025 | High Efficiency case | 2035 | About 970 TWh | 2.6% |
| IEA | Apr. 2025 | Headwinds case | 2035 | About 700 TWh | Less than 2% |
| IEA | Apr. 2026 | Estimate | 2025 | 485 TWh | Not stated |
| IEA | Apr. 2026 | Base case | 2030 | 950 TWh | About 3% |
| Goldman Sachs | Apr. 2024 | Base case, vs. 2023 | 2030 | +160% | 3% to 4% |
| Goldman Sachs | Mar. 2026 | Base case, +220% vs. 2023 | 2030 | About 1,350 TWh | Not stated |
| BloombergNEF | Nov. 2026 | Base case | 2035 | 2,354 TWh | 7% |
- The United States used 45% of the world's data center electricity in 2024, China 25%, and Europe 15%. In the IEA's base case, US data center use grows by about 240 TWh, or 130%, from 2024 to 2030, and the US and China together account for nearly 80% of global growth.
- The 2035 forecasts span more than three times from low to high, from about 700 TWh in the IEA's Headwinds case to 2,354 TWh from BloombergNEF. BloombergNEF's figure, published on November 11, 2026, equals 7% of global electricity use.
- Electricity use per AI task is falling quickly. If every conventional internet search were answered as a simple AI text query, the total would be less than 4 TWh a year, under 1% of current data center use, so the growth in the IEA's forecasts comes from heavier uses such as AI agents.
US Data Center Capacity Forecasts in Gigawatts
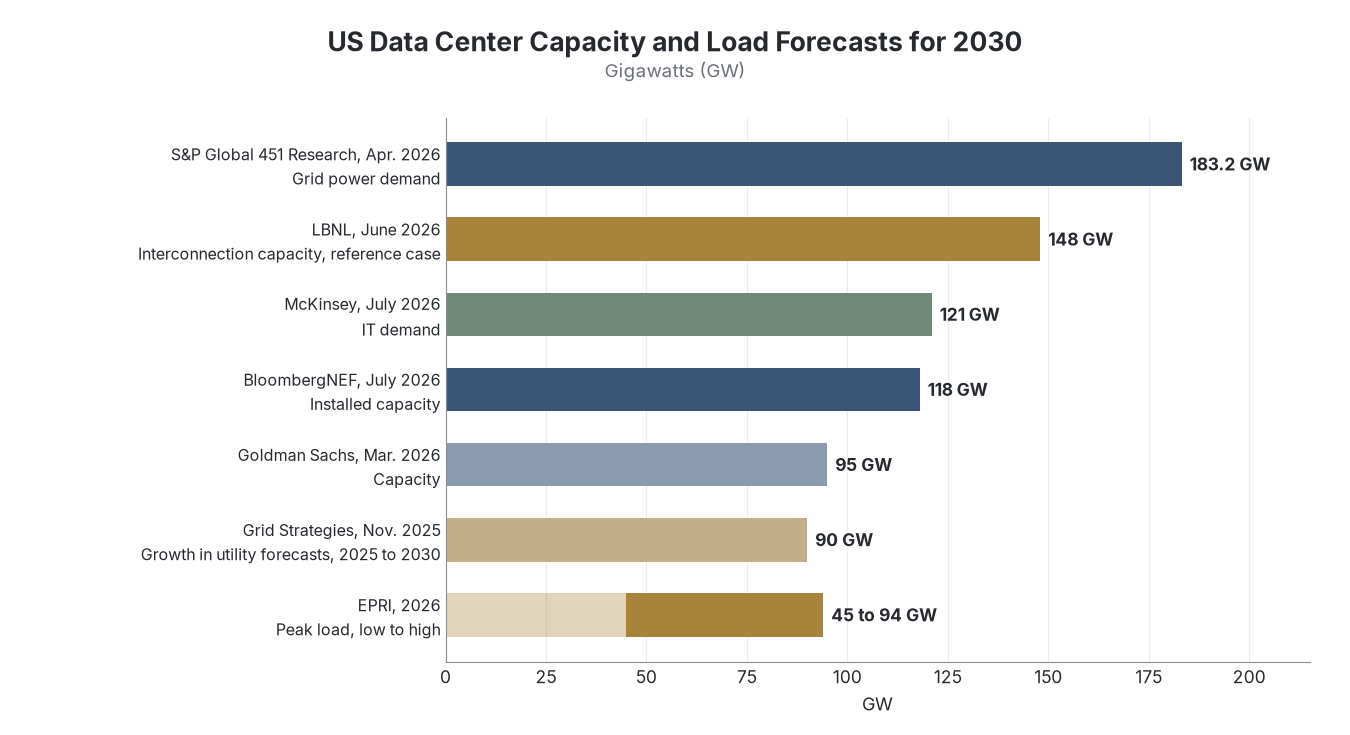
Many forecasts are given in gigawatts (GW) of capacity rather than terawatt-hours of use, because grid planners size equipment for the highest load at any moment. The figures below measure different things, from installed capacity to the grid connection a site requests, so they are listed with their measure rather than converted into one unit.
| Publisher | Published | Measure | Scenario | Year | Gigawatts |
|---|---|---|---|---|---|
| S&P Global 451 Research | May 2026 | Grid power demand | Estimate | 2025 | 64.4 GW |
| S&P Global 451 Research | June 2025 | Grid power demand | Forecast | 2030 | 117.1 GW |
| S&P Global 451 Research | Apr. 2026 | Grid power demand | Forecast | 2030 | 183.2 GW |
| BloombergNEF | July 2026 | Installed capacity | Estimate | 2025 | 47 GW |
| BloombergNEF | Dec. 2025 | Installed capacity | Base case | 2035 | 106 GW |
| BloombergNEF | July 2026 | Installed capacity | Base case | 2030 | 118 GW |
| BloombergNEF | July 2026 | Installed capacity | Base case | 2035 | 194 GW |
| EPRI | 2026 | Peak load | Low, medium, high | 2030 | 45, 71, 94 GW |
| LBNL | June 2026 | Interconnection capacity | Reference case, 50% utilization | 2030 | 148 GW |
| McKinsey | July 2026 | IT demand | Continued momentum | 2030 | 121 GW |
| Grid Strategies | Nov. 2025 | Growth in utility peak forecasts | Data centers, 2025 to 2030 | 2030 | About 90 GW |
| Goldman Sachs | Mar. 2026 | Capacity | Base case | 2030 | About 95 GW |
| EPRI | 2026 | Nominal IT capacity | Estimate, then low to high | 2024 and 2030 | 35 to 44 GW, then 56 to 132 GW |
| LBNL | Dec. 2024 | Power demand at 50% utilization | Low to high | 2028 | 74 to 132 GW |
- US grid power supplied to data centers rose 25% in 2025 to about 64.4 GW, beating the 58 GW S&P Global had forecast for the year. Virginia leads in 2026 at 16.6 GW, followed by Texas at 13.5 GW.
- Grid Strategies found that utility forecasts filed with federal regulators add up to about 90 GW of data center growth by 2030, roughly 25 GW more than other benchmarks support. Developers often request power at several sites for one project, which inflates the totals utilities report.
- Large-load interconnection requests add up to nine times McKinsey's 2030 demand estimate, and BloombergNEF has tracked 181 GW of gas-fired generation proposed alongside data centers, more than 90% of it in the US. Both figures show how much planned capacity has not yet been matched to a grid connection.
How the Forecasts Have Been Revised
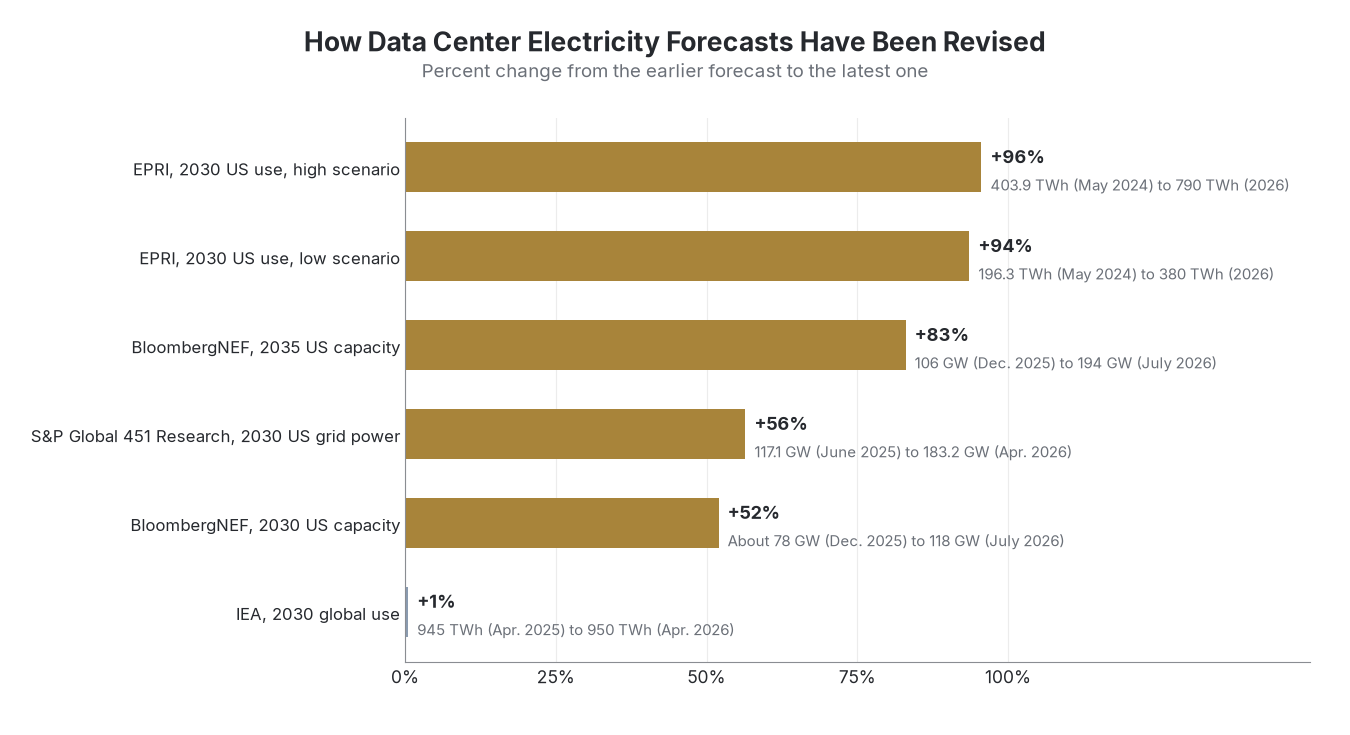
Several publishers have issued a new forecast within the past two years for the same year and measure as an earlier one, which makes it possible to see how far each moved. This section compares each pair.
| Publisher | Measure and target year | Earlier forecast | Latest forecast | Change |
|---|---|---|---|---|
| EPRI | US annual use, 2030, high scenario | 403.9 TWh (May 2024) | 790 TWh (2026) | +96% |
| EPRI | US annual use, 2030, low scenario | 196.3 TWh (May 2024) | 380 TWh (2026) | +94% |
| BloombergNEF | US installed capacity, 2035 | 106 GW (Dec. 2025) | 194 GW (July 2026) | +83% |
| S&P Global 451 Research | US grid power demand, 2030 | 117.1 GW (June 2025) | 183.2 GW (Apr. 2026) | +56% |
| BloombergNEF | US installed capacity, 2030 | About 78 GW (Dec. 2025) | 118 GW (July 2026) | +52% |
| Goldman Sachs | Global growth in use, 2030 vs. 2023 | +160% (Apr. 2024) | +220% (Mar. 2026) | +60 points |
| LBNL | US annual use, 2028 | 325 to 580 TWh (Dec. 2024) | 464 TWh reference case (June 2026) | Inside the earlier range |
| IEA | Global annual use, 2030 | 945 TWh (Apr. 2025) | 950 TWh (Apr. 2026) | +1% |
| PJM | Summer peak, near-term years through 2032 | 2025 forecast | 2026 forecast | Lower |
- The forecasts built from project lists moved the most. EPRI, BloombergNEF, and S&P Global all count announced and planned data centers, and BloombergNEF's list of announced US projects grew by 101 GW between December 2025 and July 2026. EPRI describes its 2026 projections as about 60% higher than its 2024 estimates, while its lowest and highest 2030 values each nearly doubled.
- The IEA and PJM held steady or moved down. The IEA cites shortages of gas turbines, transformers, and chip memory as limits on near-term growth, and PJM began counting only data centers with firm construction or service commitments in its near-term years.
- LBNL lowered its estimate of historical use, putting 2024 at the low end of its earlier range, because fewer GPUs shipped in 2023 and 2024 than it had assumed. Its 2028 reference case still landed in the middle of its 2024 range.
Grid Operator and Utility Outlooks
Grid operators forecast total load for their regions, and utilities report how much data center capacity they have under contract. These figures cover all customers or all large loads rather than data centers alone, but data centers are the main source of the growth in each one. This section lists the latest figure from each.
| Organization | Published | Region | Measure | Figure |
|---|---|---|---|---|
| PJM | Jan. 2026 | 13 states and Washington, DC | Summer peak, all load, 2026 to 2036 | About 156,373 MW to 222,106 MW (+42%) |
| PJM | Jan. 2026 | 13 states and Washington, DC | Annual energy, all load, 2026 to 2036 | About 856,075 GWh to 1,437,629 GWh (+68%) |
| PJM board | 2026 | 13 states and Washington, DC | Peak growth from data centers, 2024 to 2030 | About 30,000 MW of about 32,000 MW |
| ERCOT | Apr. 2026 | Most of Texas | Total demand forecast, 2032 | 367,790 MW |
| ERCOT | Apr. 2026 | Most of Texas | Data center load submitted, 2032 | 228,420 MW |
| NERC | Jan. 2026 | North America | Summer peak growth over 10 years, all load | 224 GW |
| NERC | Jan. 2026 | North America | Winter peak growth over 10 years, all load | 246 GW |
| Dominion Energy | Oct. 30, 2026 | Virginia and North Carolina | Data center capacity in stages of contracting | 54.9 GW, over 12 GW under service agreements |
| AEP | Oct. 28, 2026 | 11 states | Incremental contracted load from large customers, by 2031 | 84 GW, 15 GW signed in the third quarter |
- ERCOT's preliminary forecast of 367,790 MW for 2032 is more than four times the Texas grid's 2023 record, and ERCOT considers it higher than the load growth that will occur. The figure is used for transmission planning, not as a prediction of what will be built.
- PJM's 10-year summer peak growth rate is 3.6% a year in its 2026 forecast, against 0.3% a year in its 2021 forecast. Energy grows faster than peak, by 5.3% a year, because data centers run around the clock.
- Dominion added more than 6 GW of signed data center contracts in the first nine months of 2026, a 13% increase. Large customers in AEP's territory are expected to pay up to $21 billion in fixed costs over the lives of their contracts, which reduces what residential customers would otherwise pay.
US Electricity Sales by Sector
The EIA does not publish a separate data center line in its monthly forecast. Most data centers buy power as commercial customers, so the commercial sector is where their growth shows up in federal data. This section shows the EIA's November 2026 forecast of retail electricity sales by sector.
| Measure (billion kWh) | 2025 | 2026 (forecast) | 2027 (forecast) |
|---|---|---|---|
| Total consumption | 4,216 | 4,306 | 4,371 |
| Residential sales | 1,519 | 1,546 | 1,539 |
| Commercial sales | 1,503 | 1,557 | 1,600 |
| Industrial sales | 1,050 | 1,061 | 1,086 |
| Electric power sector generation | 4,272 | 4,387 | 4,438 |
| Average residential use per customer (kWh) | 10,491 | 10,597 | 10,471 |
- Commercial sales grow by 97 billion kWh from 2025 to 2027 in the forecast, 63% of the 155 billion kWh rise in total US consumption. Residential sales fall in 2027 because the EIA expects a milder summer.
- US consumption set records in 2024 and 2025, and the EIA forecasts new records in 2026 and 2027. Generation by the electric power sector reaches almost 4,390 billion kWh in 2026, up 2.7% from 2025.
ChatGPT, Gemini, and Claude: Electricity Per Prompt and Company Totals
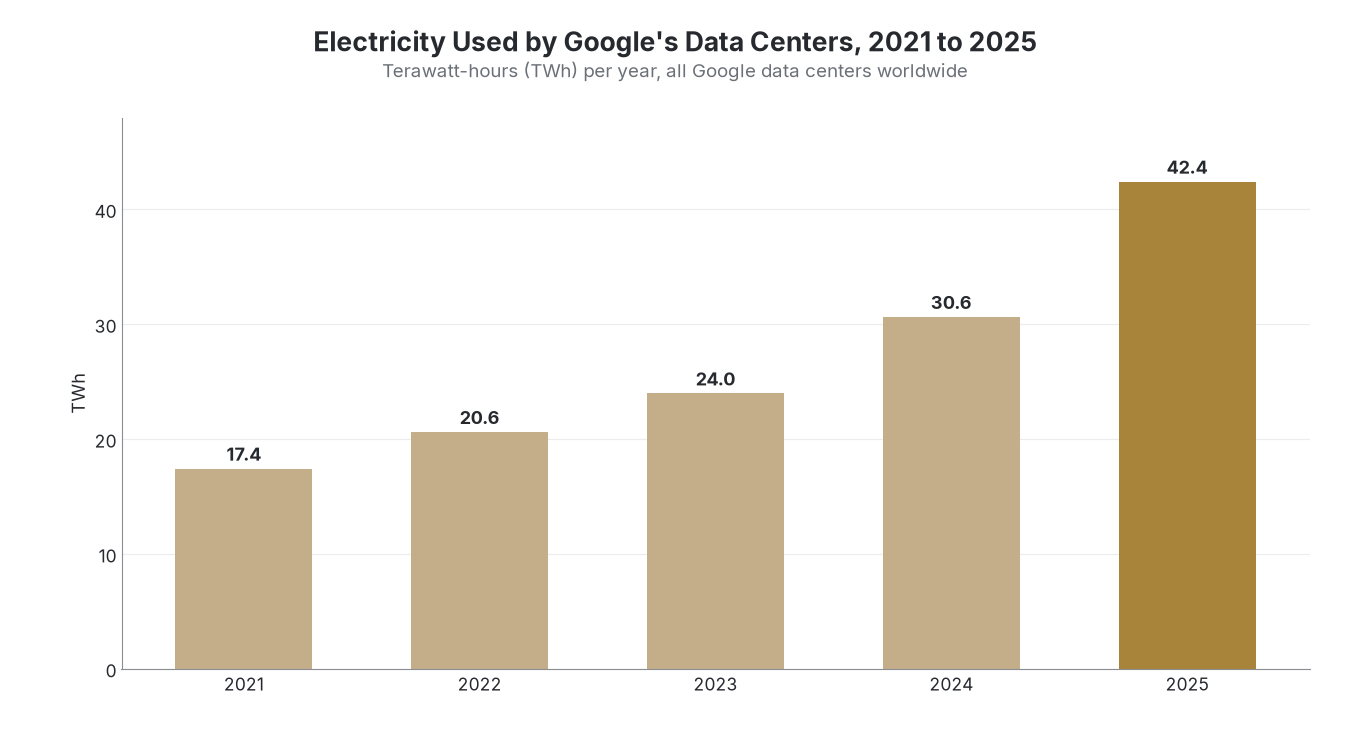
The forecasts above are built from chips, buildings, and grid requests rather than from the AI products people use. Google and OpenAI have each published one figure for the electricity used by a single prompt, and Google reports the total electricity its data centers use each year. This section lists those disclosures.
| Company and product | Disclosure | Figure | Date |
|---|---|---|---|
| Google, Gemini | Median Gemini Apps text prompt | 0.24 Wh | Aug. 2025 (prompts as of May 2025) |
| Google, Gemini | Energy per median text prompt, May 2024 to May 2025 | Fell by a factor of 33 | Aug. 2025 |
| Data center electricity use, 2025 | 42.4 TWh (+38.4% from 30.6 TWh in 2024) | 2026 Environmental Report | |
| Total electricity use, 2025 | 43.6 TWh | 2026 Environmental Report | |
| OpenAI, ChatGPT | Average ChatGPT query | About 0.34 Wh | June 10, 2025 |
| OpenAI, ChatGPT | Total electricity use | Not disclosed | As of Nov. 2026 |
| Anthropic, Claude | Per-prompt or total electricity use | Not disclosed; the Oct. 2026 S-1 filing contains no energy figure | As of Nov. 2026 |
Google's data centers used 42.4 TWh in 2025, equal to 8.7% of the 485 TWh the IEA estimates all of the world's data centers used that year. ChatGPT reached 1.2 billion weekly users in the third quarter of 2026, and OpenAI has not published its total electricity use.
- The per-prompt figures are small next to household use: 0.34 Wh is about what an oven uses in a little over one second. The growth in the forecasts comes from the number of prompts and from longer tasks such as AI agents and video generation, which use many times more energy per task than a simple text query.
- Google's data center use grew 38.4% in 2025, faster than its 28% growth in 2024. Anthropic's S-1 lists dedicated on-site natural gas generation at certain planned data centers among its risk factors.
What the Forecast Range Means for the Grid
The gap between the forecasts matters because power plants, transmission lines, and transformers have to be ordered years ahead. The forecasts published in 2026 are 463 TWh apart for 2030, from 380 TWh to 843 TWh, a difference equal to 11% of all the electricity the US used in 2025, and utilities have to decide now which end of that range to build for.
The forecasts are also moving closer to grid data. In 2024, most US estimates came from chip shipments or growth assumptions; in 2026, EPRI, BloombergNEF, S&P Global, PJM, and ERCOT all start from lists of specific projects, contracts, and interconnection requests, and the utilities report contracted gigawatts each quarter.
Dominion Energy alone reported 54.9 GW of data center capacity in stages of contracting on October 30, 2026, which is larger than the 47 GW of data center capacity BloombergNEF counts as installed in the whole country at the end of 2025.
Data: ai-electricity-demand-forecasts-2026.csv
Data Collection and Methodology
Source 1 is our own research: a dataset of 46 forecasts and reported actuals for data center electricity use, share of electricity, capacity, and load, published from April 2024 to November 11, 2026 by federal labs, the IEA, the EIA, grid operators, utilities, banks, consultancies, and research firms. Each row records the publisher, publication date, measure, scenario, geography, target year, value, and unit, and was checked against the original report, data table, or release on November 12, 2026. The dataset is available as a CSV download.
We included a forecast when its publisher released the figure itself, in a report, data table, press release, earnings release, or published article. Figures in terawatt-hours measure annual electricity use. Figures in gigawatts measure capacity or load at a point in time, and we did not convert between the two because each publisher assumes a different utilization rate. Where a publisher gives a range of scenarios, we show the lowest and highest values and any central case.
Three figures are derived. The IEA's US values combine its statement that the US used 45% of the world's 415 TWh in 2024 with its projected US increase of about 240 TWh by 2030. PJM's 2026 starting values subtract its stated 10-year increases from its 2036 forecasts. BloombergNEF's December 2025 forecast for 2030 divides its July 2026 forecast of 118 GW by its stated 52% upward revision. Goldman Sachs's March 2026 terawatt-hour and gigawatt values come from published coverage of its research note; its 220% growth figure comes from the firm's own summary.
Scopes differ between forecasters. LBNL excludes cryptocurrency mining and EPRI includes it. McKinsey's 2026 and 2030 figures are from its September 2024 medium scenario. Grid operator and utility figures cover all load or all large customers, not data centers alone, except where the measure is limited to data centers. Shares of electricity are as published. The home equivalent for one TWh uses the EIA's 2025 average residential use of 10,491 kWh per customer.
Each percentage was rounded once, from unrounded inputs. All money figures are in US dollars.
Sources
- Top GEO Agencies, AI electricity demand forecasts dataset (Source 1, our research), compiled Nov. 12, 2026. Download the data
- Lawrence Berkeley National Laboratory, United States Data Center Energy Usage Report: 2025 Update, June 2026. datacenters.lbl.gov
- Lawrence Berkeley National Laboratory, 2024 United States Data Center Energy Usage Report, Dec. 2024. eta-publications.lbl.gov
- US Department of Energy, DOE Releases New Report Evaluating Increase in Electricity Demand from Data Centers, Dec. 20, 2024. energy.gov
- EPRI, Powering Intelligence 2026: Updated Scenarios of U.S. Data Center Electricity Use and Power Strategies, Executive Summary, 2026. powering-intelligence.epri.com
- EPRI, Powering Intelligence: Analyzing Artificial Intelligence and Data Center Energy Consumption, May 2024. epri.com
- International Energy Agency, Key Questions on Energy and AI, Executive Summary, Apr. 16, 2026. iea.org
- International Energy Agency, Data centre electricity use surged in 2025, Apr. 16, 2026. iea.org
- International Energy Agency, Energy and AI, Executive Summary, Apr. 2025. iea.org
- International Energy Agency, Energy and AI: Energy demand from AI, Apr. 2025. iea.org
- US Energy Information Administration, Short-Term Energy Outlook, Nov. 10, 2026 (Table 7a). eia.gov
- Scott DiSavino, US power demand to beat record highs in 2026 and 2027 as AI use surges, EIA says, Reuters, Nov. 10, 2026. investing.com
- Goldman Sachs Research, How Rising Hyperscaler Reinvestment Impacts the 6 Ps Driving Power Growth/Constraints, Mar. 4, 2026. goldmansachs.com
- AI Power Boom Is 'Accelerating' As Goldman Sachs Forecasts Data Center's Demand To Surge 220% By 2030, Benzinga, Apr. 14, 2026. benzinga.com
- Goldman Sachs Research, Generational Growth: AI, data centers and the coming US power demand surge, Apr. 2024. goldmansachs.com
- McKinsey & Company, AI power demand in charts, Nov. 6, 2024 (medium scenario from Sept. 17, 2024). mckinsey.com
- McKinsey & Company, Powering AI: How real is the risk of overbuilding?, July 31, 2026. mckinsey.com
- BloombergNEF, Six Things to Know About BNEF's New US Data Center Capacity Outlook, July 29, 2026. about.bnef.com
- AI Boom to Drive Data Center Electricity Demand to 20% of US Total by 2035, Bloomberg, July 21, 2026. bloomberg.com
- US data centers to consume up to 194GW of power by 2035, DCD, July 2026. datacenterdynamics.com
- BloombergNEF, US Clean Power Rises With Data Centers: Three Things to Know, 2026. about.bnef.com
- BloombergNEF, Data Center Power Demand Is Set to Surge, Raising New Climate Challenges, Nov. 11, 2026. about.bnef.com
- Garrett Hering and Susan Dlin, Surging US data center power demand tests sustainability targets, S&P Global, May 6, 2026 (451 Research data). spglobal.com
- John D. Wilson and others, Power Demand Forecasts Revised Up for Third Year Running, Led by Data Centers, Grid Strategies, Nov. 2025. gridstrategiesllc.com
- PJM Interconnection, 2026 Long-Term Load Forecast Report, Jan. 14, 2026. pjm.com
- PJM Inside Lines, PJM's Updated 20-Year Forecast Continues To See Significant Long-Term Load Growth, Jan. 2026. insidelines.pjm.com
- PJM Learning Center, Load Forecasting, 2026. learn.pjm.com
- ERCOT, ERCOT Releases Preliminary Long-Term Load Forecast for Years 2026-2032 for PUCT Discussion, Apr. 15, 2026. ercot.com
- ERCOT, CEO Update, Board of Directors, Apr. 2026 (TSP large load submissions by type). ercot.com
- NERC, Resource Adequacy Risks Intensify Across North America as Demand Growth Surges, Jan. 29, 2026. nerc.com
- Diana DiGangi, Dominion sees $137M net income boost from rate increase, Utility Dive, Nov. 2, 2026. utilitydive.com
- AEP, AEP Reports Third-Quarter 2026 Earnings, Expands Capital Plan and Increases Growth Outlook, Oct. 28, 2026. aep.com
- Google, 2026 Environmental Report (energy data tables and Gemini prompt figures). sustainability.google
- Casey Crownhart, In a first, Google has released data on how much energy an AI prompt uses, MIT Technology Review, Aug. 21, 2025. technologyreview.com
- Sam Altman, The Gentle Singularity, June 10, 2025. blog.samaltman.com
- Borja Blanco, Is Claude Sustainable? What Anthropic's S-1 Reveals About Its Environmental Impact, 2026. azvai.com
- Top GEO Agencies, ChatGPT Paid Conversion Rate: Subscriber Statistics Over Time (weekly user figures). topgeoagencies.net