Average Google Ads CPC: 2026 Cost per Click by Industry Since AI Overviews
Published November 16, 2026
Cost per click (CPC) is what an advertiser pays Google each time someone clicks one of its search ads, and it is set in an auction among the advertisers bidding on the same search. In May 2024, Google began putting AI Overviews, an AI-written answer, at the top of many US results pages, and in October 2024 it started placing ads inside them. Since then, US search advertisers have paid more per click almost everywhere, though not by the same amount in every industry, so we looked at where the price of a click rose and whether it rose faster where AI Overviews appear most.
Our analysts compiled every average CPC figure in the last three editions of WordStream by LocaliQ's annual Google Ads benchmarks, which cover 23 US industries and more than 46,000 search campaigns from April 2023 to March 2026. We added the quarterly paid-click and cost-per-click changes from 20 Alphabet 10-Q and 10-K filings from 2021 to 2026, matched 21 of the industries to their AI Overview rates in DataForSEO's 2026 study of 194.6 million US search results, and recorded published measurements of AI Overview frequency, paid click-through rates, and keyword CPC. The result is a ledger of 209 dated entries, compiled on November 16, 2026.
Key Findings
- The average cost per click on US Google search campaigns was $5.42 from April 2025 to March 2026, 16.3% higher than the $4.66 average in the year that ended just before AI Overviews launched, and 2.34 times the $2.32 average in 2016.
- Attorneys and legal services paid the most per click at $9.87, followed by home and home improvement at $8.33 and dentists at $8.00. Arts and entertainment paid the least at $1.63.
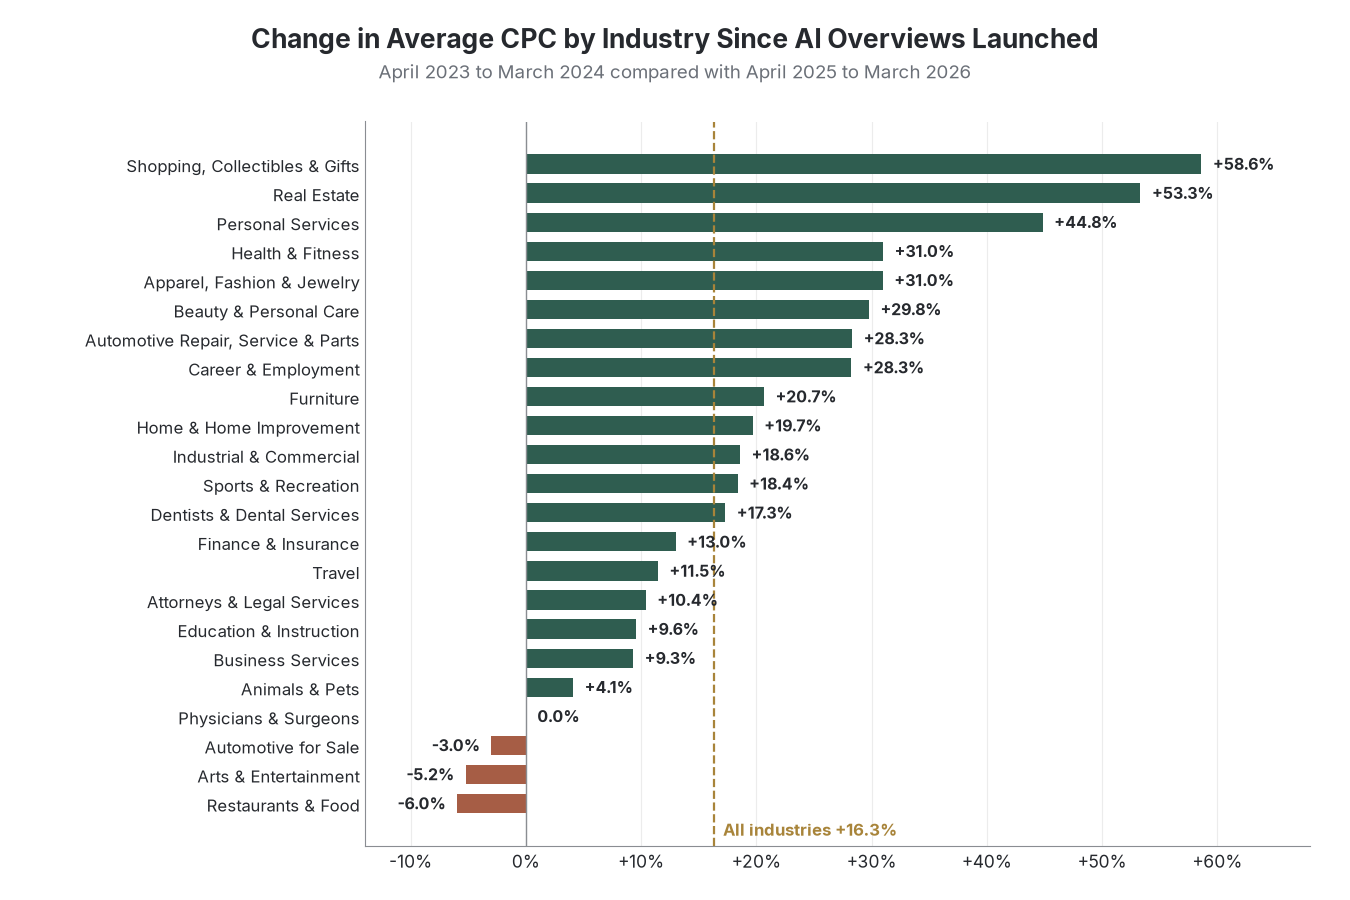
- Average CPC rose in 19 of 23 industries after AI Overviews launched, led by shopping, collectibles, and gifts (up 58.6%) and real estate (up 53.3%), the category where AI Overviews appear least often.
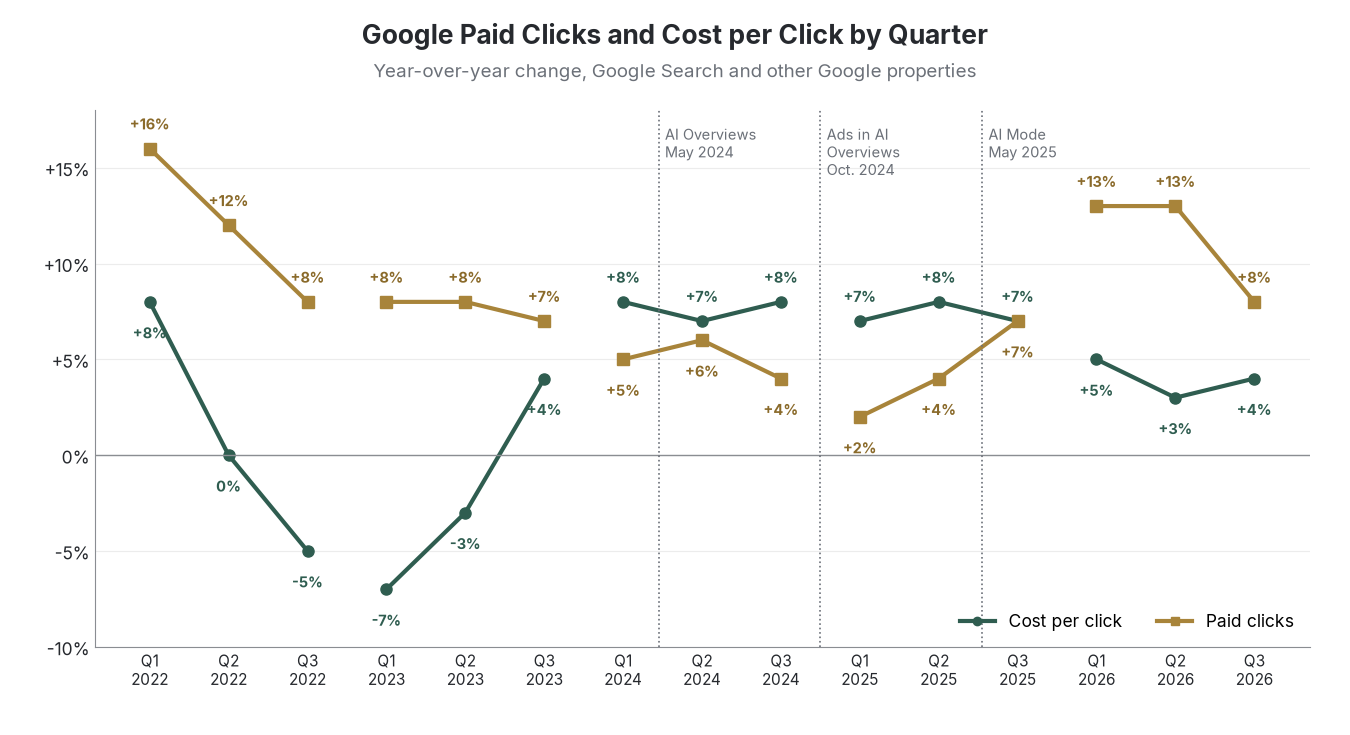
- Google's own cost per click rose 7% in both 2024 and 2025, after a 1% fall in 2022 and a 1% rise in 2023. Compounding Alphabet's yearly changes, a paid click in the third quarter of 2026 cost about 20% more than in the third quarter of 2023.
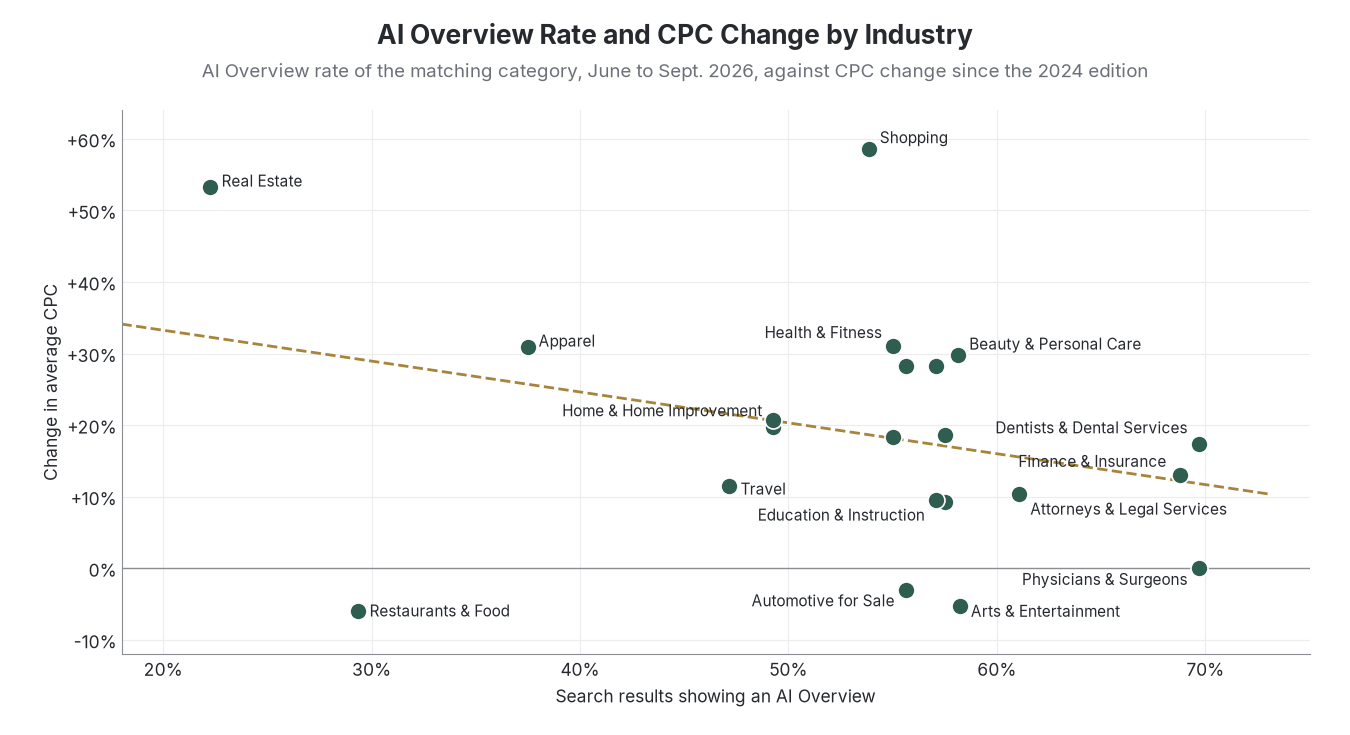
- Industries in categories where AI Overviews appear more often than average saw a median CPC increase of 11.7% since the launch, against 20.7% in industries where they appear less often.
In the following sections, we compare average Google Ads CPC by industry in 2026, how each industry's CPC changed after AI Overviews launched, Google's own quarterly cost-per-click and paid-click figures, how often AI Overviews appear in each industry and what that means for CPC, paid click-through rates when an AI Overview is shown, and the dated rollout of ads inside AI Overviews and AI Mode.
Average Google Ads CPC by Industry in 2026
This section lists the average cost per click for each of the 23 industries in the newest benchmark edition, which covers US search campaigns that ran from April 2025 to March 2026. The averages are medians, so a handful of very expensive campaigns does not pull an industry's figure up. Eight industries paid $5 or more per click, and the median across all 23 was $4.44.
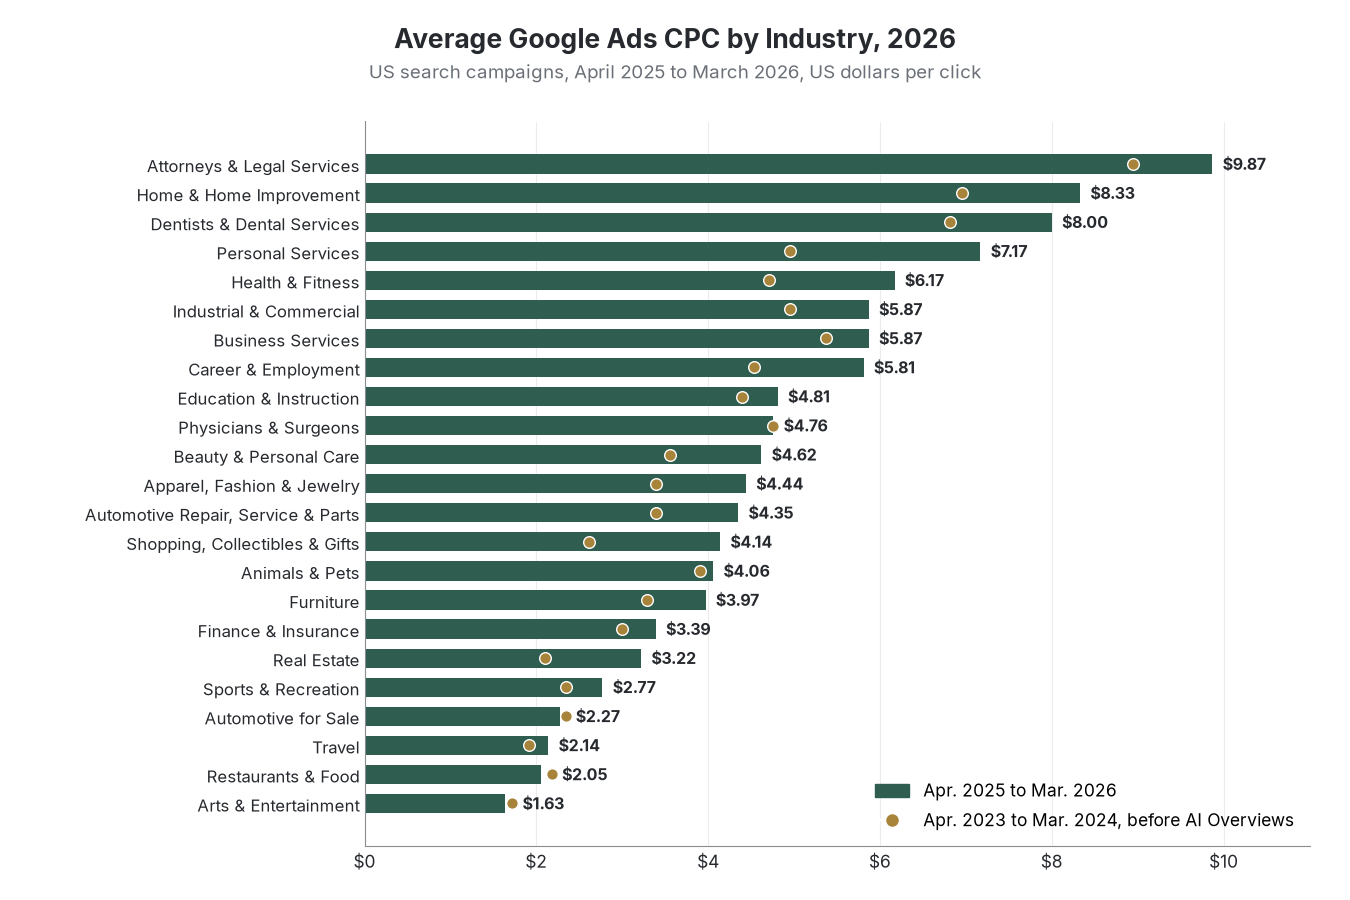
| Industry | 2026 edition (Apr. 2025 to Mar. 2026) | 2025 edition (Apr. 2024 to Mar. 2025) | 2024 edition (Apr. 2023 to Mar. 2024) | Change since 2024 edition |
|---|---|---|---|---|
| Attorneys & Legal Services | $9.87 | $8.58 | $8.94 | +10.4% |
| Home & Home Improvement | $8.33 | $7.85 | $6.96 | +19.7% |
| Dentists & Dental Services | $8.00 | $7.85 | $6.82 | +17.3% |
| Personal Services | $7.17 | $5.81 | $4.95 | +44.8% |
| Health & Fitness | $6.17 | $5.00 | $4.71 | +31.0% |
| Business Services | $5.87 | $5.58 | $5.37 | +9.3% |
| Industrial & Commercial | $5.87 | $5.70 | $4.95 | +18.6% |
| Career & Employment | $5.81 | $5.16 | $4.53 | +28.3% |
| Education & Instruction | $4.81 | $6.23 | $4.39 | +9.6% |
| Physicians & Surgeons | $4.76 | $5.00 | $4.76 | 0.0% |
| Beauty & Personal Care | $4.62 | $5.70 | $3.56 | +29.8% |
| Apparel, Fashion & Jewelry | $4.44 | $4.31 | $3.39 | +31.0% |
| Automotive Repair, Service & Parts | $4.35 | $3.90 | $3.39 | +28.3% |
| Shopping, Collectibles & Gifts | $4.14 | $3.49 | $2.61 | +58.6% |
| Animals & Pets | $4.06 | $3.97 | $3.90 | +4.1% |
| Furniture | $3.97 | $3.86 | $3.29 | +20.7% |
| Finance & Insurance | $3.39 | $3.46 | $3.00 | +13.0% |
| Real Estate | $3.22 | $2.53 | $2.10 | +53.3% |
| Sports & Recreation | $2.77 | $2.64 | $2.34 | +18.4% |
| Automotive for Sale | $2.27 | $2.41 | $2.34 | -3.0% |
| Travel | $2.14 | $2.12 | $1.92 | +11.5% |
| Restaurants & Food | $2.05 | $2.05 | $2.18 | -6.0% |
| Arts & Entertainment | $1.63 | $1.60 | $1.72 | -5.2% |
| All industries | $5.42 | $5.26 | $4.66 | +16.3% |
- Legal services have paid the highest average CPC in all three editions, and the gap to the next industry narrowed from $1.98 in the 2024 edition to $1.54 in 2026 as home improvement rose 19.7%.
- Finance and insurance averaged $3.39, below the all-industry average of $5.42. Its average fell 2.0% in the newest edition after rising 15.3% the year before.
- Across the full benchmark series, the all-industry average rose from $4.22 in the 2023 edition to $5.42 in 2026, and the newest year's 3.0% increase was the smallest of the three, so budgets set from these figures start from a higher base that is rising more slowly than in 2024 and 2025.
How CPC Changed by Industry After AI Overviews Launched
The 2024 benchmark edition ended in March 2024, two months before AI Overviews began rolling out to every US user on May 14, 2024, which makes it the last full year of CPC data from before the launch. Comparing it with the 2026 edition shows the change across the two years in which AI Overviews spread, ads appeared inside them, and Google launched AI Mode.
| Edition | Campaigns ran | US campaigns studied | Average CPC | Change from prior edition |
|---|---|---|---|---|
| 2023 edition | Apr. 2022 to Mar. 2023 | 17,253 | $4.22 | Not comparable |
| 2024 edition | Apr. 2023 to Mar. 2024 | More than 17,000 | $4.66 | +10.4% |
| 2025 edition | Apr. 2024 to Mar. 2025 | 16,446 | $5.26 | +12.9% |
| 2026 edition | Apr. 2025 to Mar. 2026 | 13,474 | $5.42 | +3.0% |
- Three industries paid less per click in 2026 than before the launch: restaurants and food (down 6.0%), arts and entertainment (down 5.2%), and automotive for sale (down 3.0%). Physicians and surgeons ended exactly where it started, at $4.76.
- Beauty and personal care and education both swung sharply. Beauty rose 60.1% in the 2025 edition and then fell 18.9%, and education rose 41.9% and then fell 22.8%, so a single year's figure for either industry can mislead.
- Shopping, collectibles, and gifts rose in both years, from $2.61 to $4.14. Retail auctions also changed in late July 2025, when Amazon left nearly all US Google Shopping auctions, and Tinuiti found that this lifted click growth and held down CPC growth for the advertisers that remained.
Google's Quarterly Cost per Click and Paid Clicks, 2022 to 2026
Alphabet reports two figures for Google's own search ads every quarter: the change in paid clicks and the change in cost per click, each against the same quarter a year earlier. They cover clicks on ads across Google Search, Maps, Gmail, and Google Play in every country, so they show the direction of the whole market rather than an average price in dollars. The 10-K reports the full year, which is why the fourth quarter has no separate figure.
| Quarter | Paid clicks, year-over-year | Cost per click, year-over-year | Google Search & other revenue | Revenue, year-over-year |
|---|---|---|---|---|
| Q1 2022 | +16% | +8% | $39,618 million | +24.3% |
| Q2 2022 | +12% | 0% | $40,689 million | +13.5% |
| Q3 2022 | +8% | -5% | $39,539 million | +4.3% |
| Q1 2023 | +8% | -7% | $40,359 million | +1.9% |
| Q2 2023 | +8% | -3% | $42,628 million | +4.8% |
| Q3 2023 | +7% | +4% | $44,026 million | +11.3% |
| Q1 2024 | +5% | +8% | $46,156 million | +14.4% |
| Q2 2024 | +6% | +7% | $48,509 million | +13.8% |
| Q3 2024 | +4% | +8% | $49,385 million | +12.2% |
| Q1 2025 | +2% | +7% | $50,702 million | +9.8% |
| Q2 2025 | +4% | +8% | $54,190 million | +11.7% |
| Q3 2025 | +7% | +7% | $56,567 million | +14.5% |
| Q1 2026 | +13% | +5% | $60,399 million | +19.1% |
| Q2 2026 | +13% | +3% | $63,271 million | +16.8% |
| Q3 2026 | +8% | +4% | $63,350 million | +12.0% |
| Year | Paid clicks, year-over-year | Cost per click, year-over-year | Google Search & other revenue |
|---|---|---|---|
| 2021 | +23% | +15% | $148,951 million |
| 2022 | +10% | -1% | $162,450 million |
| 2023 | +7% | +1% | $175,033 million |
| 2024 | +5% | +7% | $198,084 million |
| 2025 | +6% | +7% | $224,532 million |
- Google's cost per click fell in every separately reported quarter from Q3 2022 to Q2 2023. It has risen in every separately reported quarter since Q3 2023 and in both full years since AI Overviews launched.
- Paid-click growth slowed to 2% in Q1 2025 and then jumped to 13% in Q1 and Q2 2026, while cost-per-click growth eased to 3% to 5%. Tinuiti's US clients saw the same pattern: Google search CPC rose 1% in Q2 2026 and 4% in Q3, after averaging 0% from Q3 2025 through Q2 2026, which Tinuiti linked to Amazon's exit from Shopping auctions.
- Search and other revenue grew 43.9% from Q3 2023 to Q3 2026, to $63.35 billion, about what a 20% rise in paid clicks and a 20% rise in cost per click would produce together. On October 28, 2026, Google said fast growth in AI Mode queries had weighed on Search revenue because AI Mode is monetized at a lower rate.
AI Overview Frequency and CPC by Industry
To see whether CPC moved differently where AI Overviews are most common, we matched 21 of the 23 benchmark industries to the closest industry category in DataForSEO's 2026 study, which measured how often AI Overviews appeared on 194.6 million US search results from June to September 2026. Personal services and animals and pets have no matching category and are left out. Across all industries, 56.7% of results showed an AI Overview.
| DataForSEO category | Results with an AI Overview, June to Sept. 2026 | Matching benchmark industries | CPC change since 2024 edition |
|---|---|---|---|
| Health | 69.68% | Dentists & Dental Services; Physicians & Surgeons | +17.3%; 0.0% |
| Finance | 68.80% | Finance & Insurance | +13.0% |
| Law and Government | 61.07% | Attorneys & Legal Services | +10.4% |
| Arts and Entertainment | 58.22% | Arts & Entertainment | -5.2% |
| Beauty and Personal Care | 58.14% | Beauty & Personal Care | +29.8% |
| Business and Industrial | 57.51% | Business Services; Industrial & Commercial | +9.3%; +18.6% |
| Jobs and Education | 57.08% | Career & Employment; Education & Instruction | +28.3%; +9.6% |
| Vehicles | 55.63% | Automotive Repair, Service & Parts; Automotive for Sale | +28.3%; -3.0% |
| Sports and Fitness | 55.02% | Health & Fitness; Sports & Recreation | +31.0%; +18.4% |
| Occasions and Gifts | 53.85% | Shopping, Collectibles & Gifts | +58.6% |
| Home and Garden | 49.28% | Home & Home Improvement; Furniture | +19.7%; +20.7% |
| Travel and Tourism | 47.17% | Travel | +11.5% |
| Apparel | 37.48% | Apparel, Fashion & Jewelry | +31.0% |
| Dining and Nightlife | 29.37% | Restaurants & Food | -6.0% |
| Real Estate | 22.27% | Real Estate | +53.3% |
- The relationship is weak and negative. The correlation between an industry's AI Overview rate and its CPC change is -0.30, and the 10 industries in categories above the 56.7% average had a median increase of 11.7%, against 20.7% for the 11 below it.
- AI Overviews do not avoid expensive searches. In DataForSEO's data, keywords costing $5 or more per click showed an AI Overview 49.55% of the time, almost the same as the 50.54% rate for keywords costing 25 cents or less. In Semrush's study of 600,000 US keywords from November 2025 to April 2026, jobs and education keywords with an AI Overview averaged $5.02 per click, against $1.51 for those without one, and finance keywords averaged $4.84 against $2.14.
- The rate depends heavily on how a study picks its keywords. Suff Digital, which checked 20,000 commercial and service keywords on September 23, 2026, found AI Overviews on 78.5% of real estate searches, against 22.27% across all real estate keywords in DataForSEO's data.
| Industry | Searches with an AI Overview |
|---|---|
| Software (SaaS) | 83.4% |
| Real estate | 78.5% |
| Mortgage | 72.4% |
| Electrical | 70.9% |
| Higher education | 70.2% |
| Plastic surgery | 69.4% |
| Pest control | 68.7% |
| Banking and loans | 66.2% |
| Plumbing | 49.3% |
| Dental | 49.0% |
| Auto dealers | 48.1% |
| Home remodeling | 40.7% |
| Personal injury law | 38.8% |
| Senior care | 35.2% |
| Moving companies | 34.4% |
Paid Click-Through Rates When an AI Overview Appears
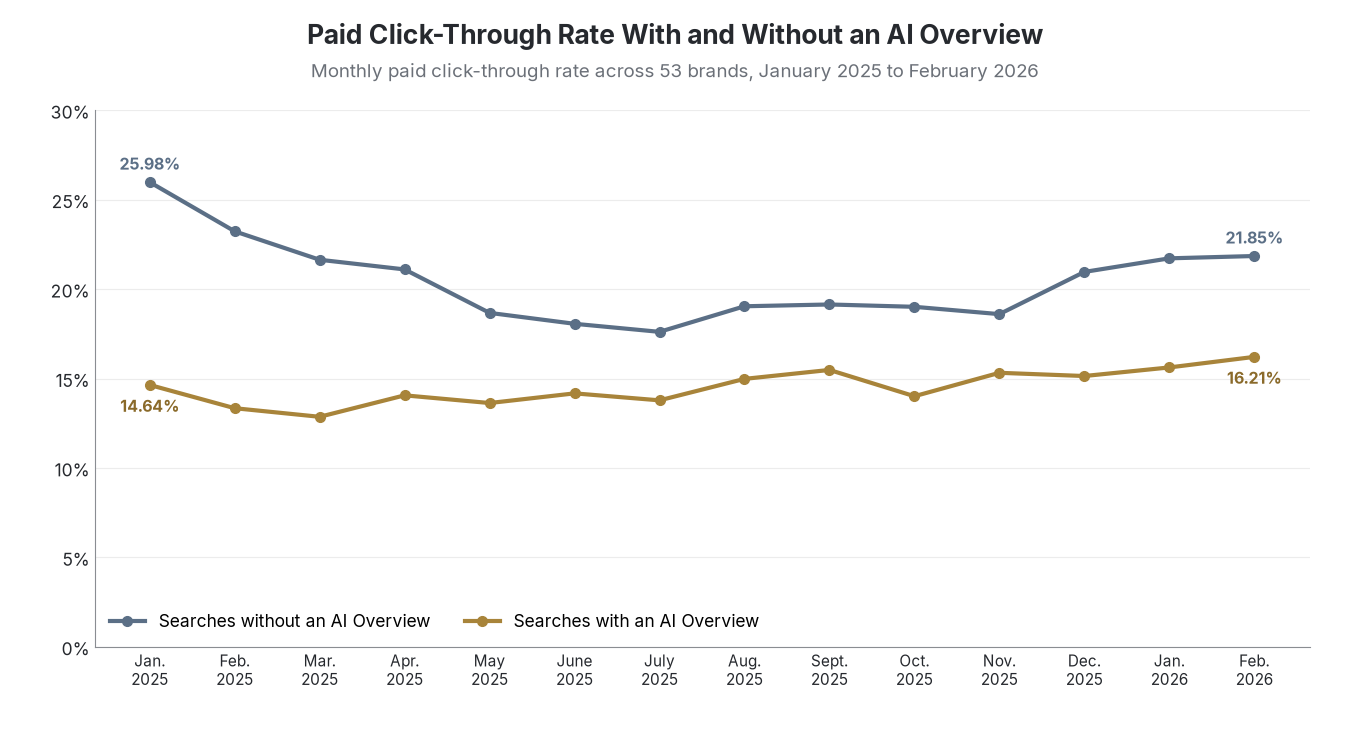
Click-through rate, the share of people who see an ad and click it, sets how many clicks an advertiser buys at a given CPC. Seer Interactive tracked paid and organic click-through rates for 53 brands from January 2025 to February 2026, across 5.47 million search terms and 296.9 million paid impressions, and split the searches by whether they show an AI Overview.
| Month | Paid, no AI Overview | Paid, with AI Overview | Organic, no AI Overview | Organic, with AI Overview |
|---|---|---|---|---|
| Jan. 2025 | 25.98% | 14.64% | 2.75% | 3.19% |
| Feb. 2025 | 23.23% | 13.34% | 3.15% | 3.56% |
| Mar. 2025 | 21.64% | 12.86% | 3.45% | 3.03% |
| Apr. 2025 | 21.10% | 14.06% | 3.44% | 2.76% |
| May 2025 | 18.67% | 13.63% | 3.03% | 2.35% |
| June 2025 | 18.06% | 14.17% | 3.07% | 2.06% |
| July 2025 | 17.61% | 13.78% | 3.07% | 1.81% |
| Aug. 2025 | 19.04% | 14.98% | 2.70% | 1.77% |
| Sept. 2025 | 19.14% | 15.48% | 2.99% | 2.14% |
| Oct. 2025 | 19.01% | 14.01% | 2.74% | 1.72% |
| Nov. 2025 | 18.60% | 15.32% | 2.45% | 1.33% |
| Dec. 2025 | 20.96% | 15.14% | 3.16% | 1.31% |
| Jan. 2026 | 21.72% | 15.62% | 3.88% | 2.33% |
| Feb. 2026 | 21.85% | 16.21% | 3.82% | 2.36% |
- Ads on searches with an AI Overview drew fewer clicks per impression than ads on searches without one in every month, but the gap narrowed from 11.34 percentage points in January 2025 to 5.64 points in February 2026.
- Paid click-through rates on searches with an AI Overview stayed between 12.86% and 16.21% for all 14 months, while organic rates on those searches fell to 1.31% in December 2025 before recovering to 2.36%.
- A lower click-through rate means an advertiser pays for fewer clicks per thousand searches, so a flat CPC on a search with an AI Overview can still bring in fewer visitors than the same CPC did before the AI Overview appeared.
Ads Inside AI Overviews and AI Mode: Dated Timeline With CPC Readings
The table below lines up each change Google made to ads in its AI results with the cost-per-click change Alphabet reported for that quarter. Google's AI search ads run in AI Overviews and AI Mode, and the Gemini app carries no ads. A fuller record of AI search ad forecasts and rollouts outside Google is in our report on AI search ad spending.
| Date | Change | Google cost per click, year-over-year, that quarter |
|---|---|---|
| May 14, 2024 | AI Overviews begin rolling out to everyone in the US | Q2 2024: +7% |
| Oct. 3, 2024 | Ads inside AI Overviews go live for US mobile users | Q4 2024: not reported separately (2024: +7%) |
| May 20, 2025 | AI Mode rolls out to everyone in the US | Q2 2025: +8% |
| May 21, 2025 | Ads in AI Overviews reach US desktop; Google begins testing ads in AI Mode | Q2 2025: +8% |
| Late July 2025 | Amazon leaves nearly all US Google Shopping auctions | Q3 2025: +7% |
| Oct. 29, 2025 | Google says AI Overviews monetize at approximately the same rate as regular search | Q4 2025: not reported separately (2025: +7%) |
| Dec. 2025 | Ads in AI Overviews documented in 12 English-language markets | Q4 2025: not reported separately (2025: +7%) |
| Feb. 11, 2026 | Shopping ads come to AI Mode | Q1 2026: +5% |
| May 20, 2026 | New ad formats for AI Mode introduced at Google Marketing Live | Q2 2026: +3% |
| Aug. 17, 2026 | Google changes how target-based bid strategies work in budget-limited campaigns | Q3 2026: +4% |
| Oct. 28, 2026 | Ads in AI Mode expand to 10 more countries; Google says AI Mode's lower monetization weighed on Search revenue | Q4 2026: not yet reported |
| Nov. 4, 2026 | Up to four ads can appear under a single AI Mode answer | Q4 2026: not yet reported |
- Google's cost per click kept rising after every step in the rollout, but the size of the yearly increase fell from 8% in Q2 2025 to 3% in Q2 2026.
- Alphabet does not report revenue, clicks, or CPC for AI Overviews or AI Mode separately, so the effect of these ad slots is only visible in the company-wide figures.
What Google Ads CPC Statistics Show Since AI Overviews
For advertisers, the period since AI Overviews launched has meant paying more for each click while Google sells more of them. Google's paid clicks grew in every quarter it reported, and in 2026 click growth picked up while price growth slowed, after Amazon's exit from Shopping auctions removed one of the largest bidders.
Price increases have been largest in industries whose searches show AI Overviews less often, such as real estate, apparel, and gifts, and smaller in legal, medical, and finance searches, where AI Overviews are most common. Where an AI Overview does appear, ads still draw fewer clicks per impression than on other searches, so the cost of each visitor there depends on click-through rate as much as on CPC.
In the third quarter of 2026, Google's paid clicks and its cost per click were each about 20% above their levels three years earlier, and Search and other revenue reached $63.35 billion, up from $44.03 billion in the third quarter of 2023.
Data: google-ads-cpc-data-2026.csv
Data Collection and Methodology
Source 1 is our own research: a ledger of 209 dated entries compiled on November 16, 2026. It contains the average CPC for 23 industries and for all industries from the 2024, 2025, and 2026 editions of WordStream by LocaliQ's Google Ads benchmarks, the 2016 and 2023 all-industry averages, the quarterly and full-year paid-click change, cost-per-click change, and Google Search & other revenue from 20 Alphabet 10-Q and 10-K filings for 2021 through the third quarter of 2026, AI Overview trigger rates from DataForSEO and Suff Digital, monthly click-through rates from Seer Interactive, keyword CPC figures from Semrush, and quarterly US Google search figures from Tinuiti. Each row records the measure, period, dates, value, unit, scope, and source.
The benchmark averages are medians of LocaliQ customer search campaigns in the US, with about 80% to 85% of budget on Google Ads and 15% to 20% on Microsoft Advertising. Each edition covers April through March: the 2024 edition covers more than 17,000 campaigns from April 2023 to March 2024, the 2025 edition 16,446 campaigns from April 2024 to March 2025, and the 2026 edition 13,474 campaigns from April 2025 to March 2026. We treat the 2024 edition as the last full year before AI Overviews, which began rolling out to all US users on May 14, 2024. Changes between editions are calculated from the published averages and rounded once.
Alphabet's paid clicks cover ads on Google search properties and other Google-owned properties, including Gmail, Google Maps, and Google Play, in all countries. Cost per click is click-driven revenue divided by paid clicks. The 10-Q filings report the change against the same quarter of the previous year; the fourth quarter appears only inside the full-year figure in the 10-K. Multi-year changes compound the reported yearly changes, which are themselves rounded to whole percentages, so they are approximate.
To compare CPC changes with AI Overview frequency, we matched each benchmark industry to the closest of DataForSEO's 22 industry categories: legal services to Law and Government; dentists and physicians to Health; finance and insurance to Finance; business services and industrial to Business and Industrial; career and education to Jobs and Education; both automotive industries to Vehicles; health and fitness and sports to Sports and Fitness; home improvement and furniture to Home and Garden; shopping and gifts to Occasions and Gifts; restaurants to Dining and Nightlife; and travel, apparel, beauty, real estate, and arts to their named equivalents. Personal services and animals and pets have no clear match and are excluded. The correlation of -0.30 is a Pearson coefficient across the 21 matched industries. DataForSEO's rates come from 194.6 million US English search result records collected June 16 to September 10, 2026.
Seer Interactive's click-through rates cover 53 client brands and only search terms with complete data in every month; its AI Overview label comes from the most recent results snapshot and is applied to all months. Semrush's CPC comparison covers more than 600,000 keywords in its US desktop database from November 2025 to April 2026. All money figures are in US dollars.
Sources
- Top GEO Agencies, Google Ads CPC ledger (Source 1, our research), compiled Nov. 16, 2026. Download the data
- WordStream by LocaliQ, Search Advertising Benchmarks by Industry: Competitive Data & Insights for 2026, May 2026. wordstream.com
- LocaliQ, Search Advertising Benchmarks for Every Industry [2026 Data]. localiq.com
- WordStream, Google Ads Benchmarks 2025: Competitive Data & Insights for Every Industry, 2025. wordstream.com
- LocaliQ, Search Advertising Benchmarks for Every Industry [2024 Data], archived July 19, 2024. web.archive.org
- WordStream, Digital Benchmarks by Industry: PPC (2020 to 2026 benchmarks). wordstream.com
- Alphabet Inc., Form 10-Q for the quarter ended Sept. 30, 2026. sec.gov
- Alphabet Inc., Form 10-Q for the quarter ended June 30, 2026. sec.gov
- Alphabet Inc., Form 10-Q for the quarter ended March 31, 2026. sec.gov
- Alphabet Inc., Form 10-K for 2025. sec.gov
- Alphabet Inc., Forms 10-Q and 10-K, 2021 to 2025, EDGAR filing index. sec.gov
- DataForSEO, Search Insider 2026. dataforseo.com
- Arshia Kahani, AI Overviews by Industry: Health 70%, Real Estate 22%, Am I Cited, Nov. 7, 2026. amicited.com
- Leeroy Powell, Health 69.7%, Finance 68.8%, Law 61.1%: The Industries Most Exposed to AI Overviews, MarGen, Nov. 4, 2026. margen.net
- Matt Suffoletto, Google Now Shows an AI Answer on 57.6% of Commercial Searches, Suff Digital, Sept. 24, 2026. suffdigital.com
- Luke Harsel, AI Overviews are expanding across commercial intent search [Study], Semrush, July 2, 2026. semrush.com
- Seer Interactive, AIO Impact on Google CTR: 2026 Update, April 2026. seerinteractive.com
- Tinuiti, Digital Ads Benchmark Report Q3 2026, Oct. 2026. tinuiti.com
- MediaPost, Google Paid Search Becoming More Expensive, Oct. 16, 2026. mediapost.com
- Google, Elizabeth Reid, Generative AI in Search: Let Google do the searching for you, May 14, 2024. blog.google
- Google, Google Lens and AI Overviews: New ways for marketers to reach customers, Oct. 3, 2024. blog.google
- Google, AI Mode in Google Search: Updates from Google I/O 2025, May 20, 2025. blog.google
- Search Engine Land, Anu Adegbola, Google expands ads in AI Overviews, AI Mode to desktop, May 21, 2025. searchengineland.com
- Search Engine Roundtable, Barry Schwartz, Google Expands Ads In AI Overviews To More Countries, Dec. 22, 2025. seroundtable.com
- Search Engine Land, Leigh Buttrey, Google AI Mode ads: Everything you need to know, Oct. 9, 2026. searchengineland.com
- Google, Shashi Thakur, Ads in AI Mode expand to 10 new countries, Oct. 28, 2026. blog.google
- PPC Land, Luis Rijo, Is AI Mode doomed? What Alphabet's $482bn sell-off really says, Nov. 4, 2026. ppc.land
- PPC Land, Luis Rijo, Google AI Mode gains a fourth ad slot below some answers, Nov. 5, 2026. ppc.land
- 9to5Google, Andrew Romero, Google DeepMind CEO reiterates 'no plans' for Gemini ads, Jan. 21, 2026. 9to5google.com
- Top GEO Agencies, AI Search Ad Spending: Every Forecast. topgeoagencies.net
Source: Top GEO Agencies compilation of WordStream by LocaliQ Google Ads benchmarks, 2024, 2025, and 2026 editions; changes calculated from the published averages.
Source: WordStream by LocaliQ, PPC benchmarks archive and 2023 to 2026 reports; changes calculated by Top GEO Agencies.
Source: Alphabet Inc. Forms 10-Q for Q1 2022 to Q3 2026; revenue changes calculated from the reported quarters.
Source: Alphabet Inc. Forms 10-K for 2021 to 2025.
Source: DataForSEO, Search Insider 2026; WordStream by LocaliQ benchmarks; category matching and changes by Top GEO Agencies.
Source: Suff Digital, Google AI Overviews 2026 study of 20,000 desktop searches across 24 industries, collected Sept. 23, 2026; it published 15 of the industry rates.
Source: Seer Interactive, AIO Impact on Google CTR: 2026 Update, April 2026.
Source: Google; Search Engine Land; Search Engine Roundtable; PPC Land; MediaPost; Alphabet Inc. Forms 10-Q and 10-K.