The AI Search vs. Google Paper, Explained
Published October 16, 2026
Generative Engine Optimization: How to Dominate AI Search is a 2025 paper by Mahe Chen, Xiaoxuan Wang, Kaiwen Chen, and Nick Koudas of the University of Toronto, posted as a preprint on arXiv in September 2025. The original GEO paper tested how rewriting a page changes its visibility inside AI answers. This paper looks at which kinds of websites AI search engines cite in the first place, comparing ChatGPT, Perplexity, Gemini, and Claude with Google across product categories, local services, languages, and ways of phrasing a question (pages 1 and 2, Sections 1 and 1.1).
Our researchers read through the paper and created this report to break down its findings in simple terms and talk about what they mean for brands and marketers. In the following sections, we explain how the experiments were set up, what the authors concluded, how AI search and Google differ in the sources they cite, how local business searches compare, how the AI engines differ from each other, how they treat large and small brands, and the limits the authors point out themselves.
The Main Experiment
The authors wanted to know whether a website that ranks well on Google is also the kind of website AI search engines cite, and what types of sources those engines prefer (page 1, Section 1).
The setup
Most tests used ranking-style questions such as "Rank the best smartphones from 1 to 10," because those answers are easy to compare (page 6, Section 4.1.1). The questions were sent to four AI engines with web search turned on: Perplexity's sonar-pro, Claude 3.5 Sonnet with its web search tool, Gemini 2.5 Flash with Google Search grounding, and OpenAI's gpt-4o-search-preview. For Google, the researchers collected the top 10 results for the same questions through Google's search API (page 6, Section 4.1.2). The data was collected in August 2025 (page 26, Section 7).
The questions
- The main comparison used 1,000 consumer ranking questions, 100 in each of 10 product categories, asked for the United States and for Canada, with analysis focused on consumer electronics, cars, and software (pages 6 and 7, Section 4.2.1).
- A local test asked for businesses such as home cleaners and dentists (page 8, Section 4.2.2).
- A language test translated 100 English questions into Chinese, Japanese, German, French, and Spanish, and a wording test rewrote the same questions in seven styles, such as asking for sources or using keywords only (pages 8 to 11, Sections 4.2.3 and 4.2.4).
- Later tests compared the AI engines with each other on well-known and niche brands, cars, local services, soda brands, and banks (pages 13 to 22, Section 5).
How sources were sorted
Every cited website was placed into one of three groups by gpt-4o-search-preview (page 6, Section 4.1.4).
- Brand sites are official company websites, such as chase.com.
- Earned sites are independent media, review, and comparison sites, such as nerdwallet.com and forbes.com.
- Social sites are forums, video platforms, and other user-generated content, such as reddit.com and youtube.com.
How they measured
- Overlap is the share of cited websites two result sets have in common, either among the top 5 or top 10 results or across all citations (page 6, Section 4.1.5).
- Source mix is the percentage of citations that fall into each of the three groups (page 6, Section 4.1.6).
What the Paper Concluded
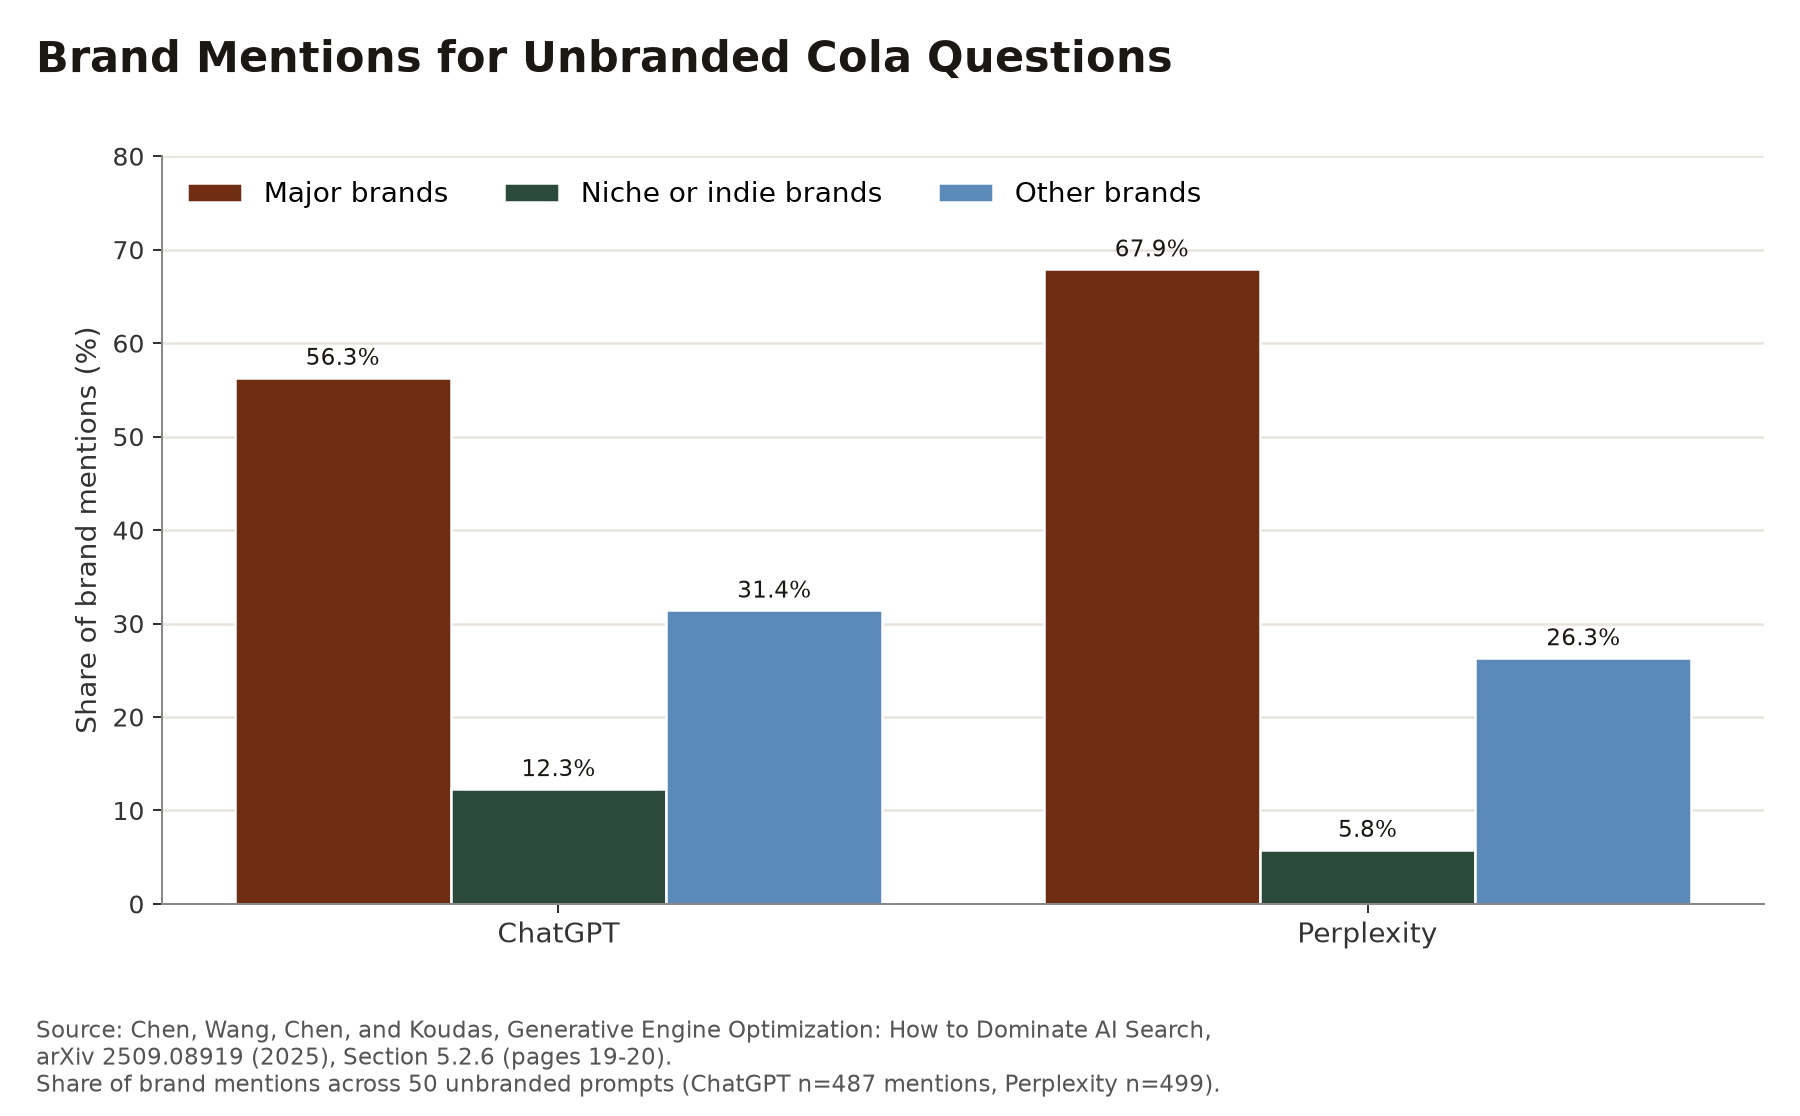
The authors concluded that AI search engines show "a systematic and overwhelming bias towards Earned media (third-party, authoritative sources) over Brand-owned and Social content, a stark contrast to Google's more balanced mix" (page 1, Abstract). They also found that the AI engines differ from each other in which websites they cite, how recent those pages are, how they handle other languages, and how much the wording of a question changes the results (page 1, Abstract). In the bank test, for example, earned sources made up 64.6% of all citations across the four engines (page 21, Section 5.2.7). When a question did not name a brand, answers leaned toward market leaders: across ChatGPT and Perplexity, 62.2% of soda brand mentions went to major brands and 9.0% to niche brands (page 20, Section 5.2.6).
Where AI Search and Google Get Their Sources
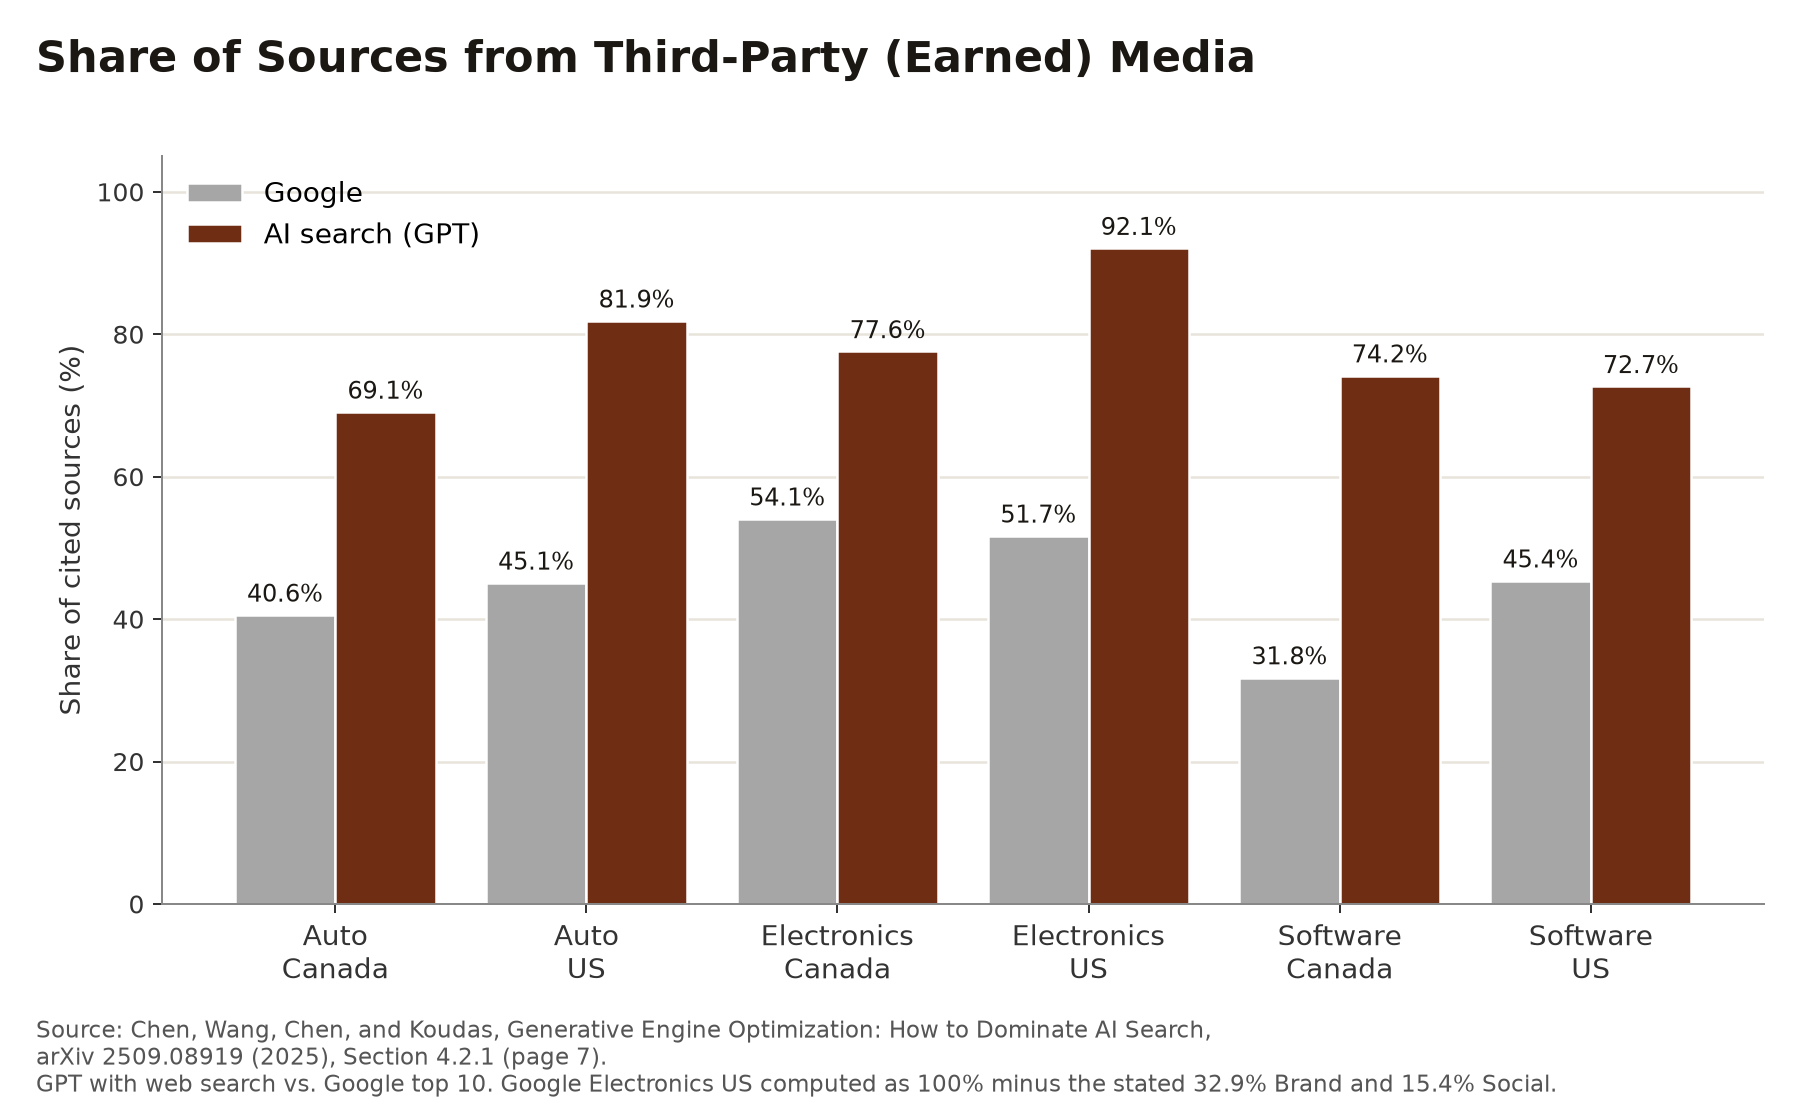
The chart below compares the share of sources that came from earned media in Google's results and in GPT's cited links, for each category and country, using the figures in Section 4.2.1 of the paper (page 7).
Re-charted from Chen et al. Section 4.2.1.
- Social sites nearly disappeared from AI answers. In Canada, Google's car results were 22.8% social, while AI search returned no social results at all, and AI answers on consumer electronics in Canada were 0.3% social (page 7, Section 4.2.1).
- Software showed the sharpest flip. In Canada, Google favored company websites, at 53.8% of results, while AI search drew most of its sources from third-party sites (page 7, Section 4.2.1).
- The two systems overlapped only partly. Electric cars showed one of the highest overlaps, with 33% of websites shared in the top 5 and over 50% in the top 10 (page 7, Section 4.2.1).
By type of question
The authors also grouped questions by intent (pages 12 and 13, Section 4.3).
- For informational questions, such as "What is Wi-Fi 7?", GPT relied on earned sites and nearly excluded social ones, while Google balanced all three groups.
- For comparison questions, such as "Garmin vs Apple Watch," earned sites dominated on every system.
- For buying questions, brand sites rose on every system, and GPT leaned on brand sites the most.
Local Business Searches
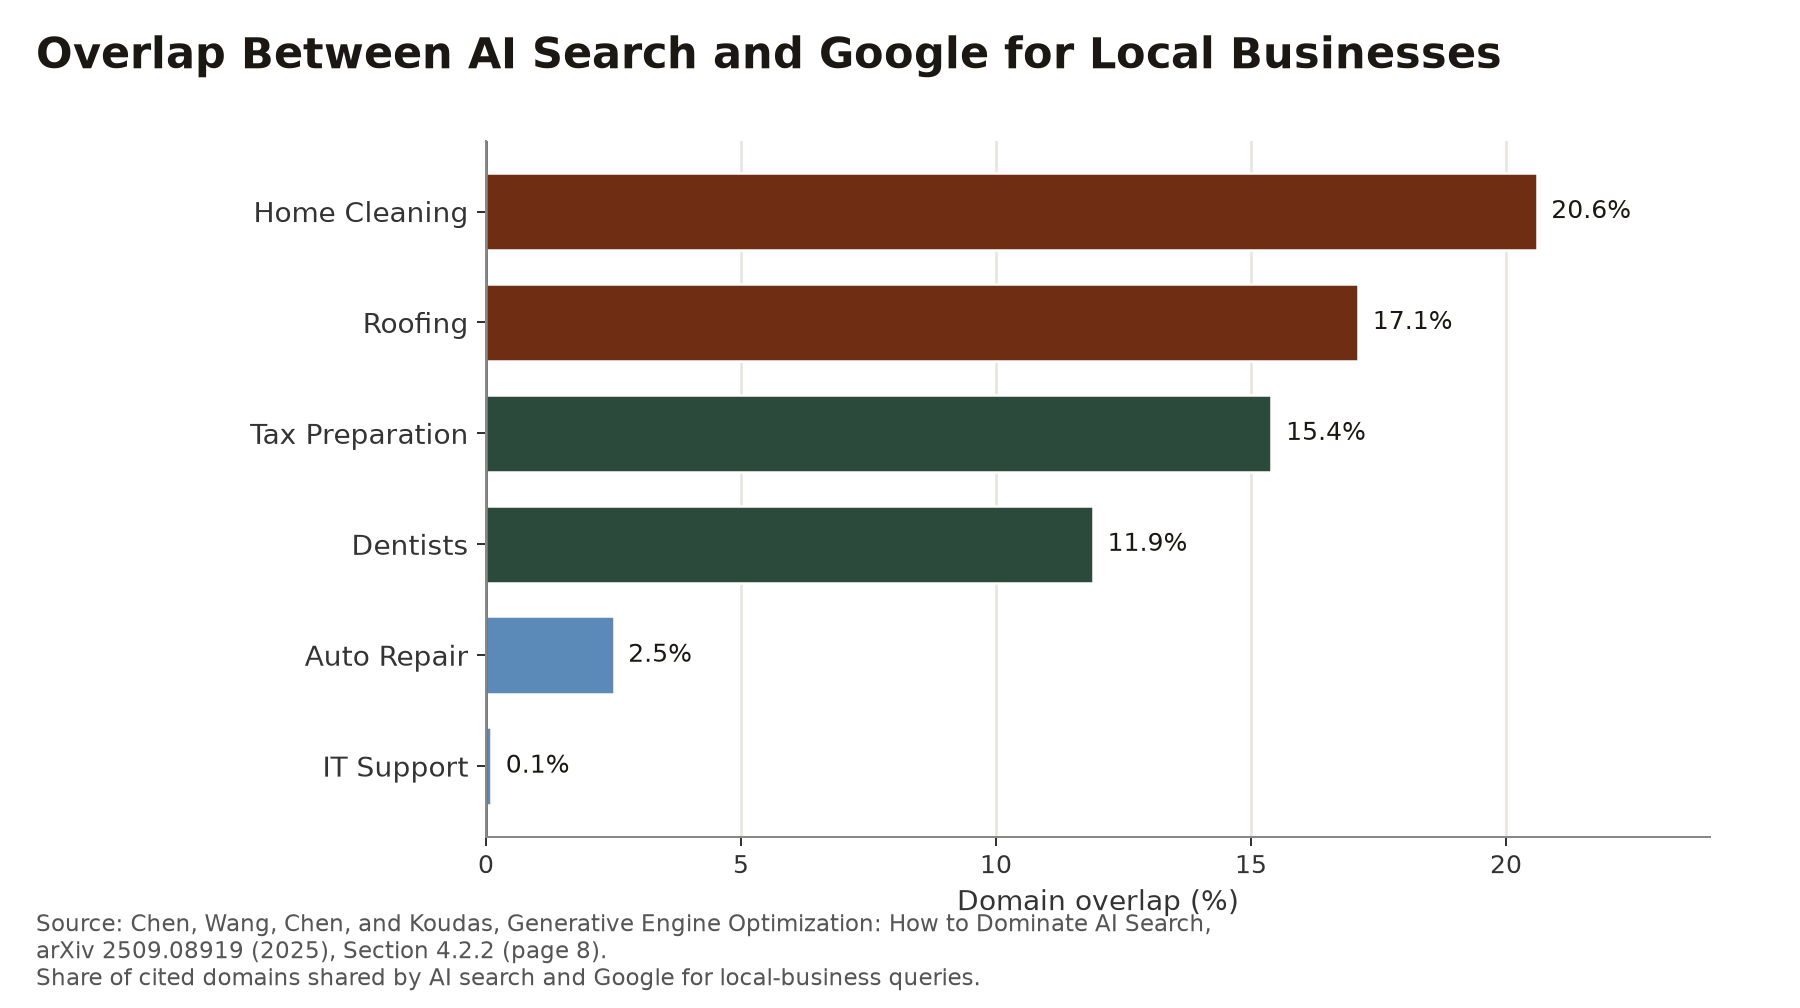
For local business questions, the authors measured how many cited websites Google and AI search had in common in each type of business (page 8, Section 4.2.2).
Re-charted from Chen et al. Section 4.2.2.
Overlap for local searches was much lower than in the product categories. The authors suggest that AI engines weigh local authority and business directories differently from Google, and that appearing in local AI answers takes "distinct strategies beyond traditional Google Local SEO" (page 8, Section 4.2.2).
How the AI Engines Differ from Each Other
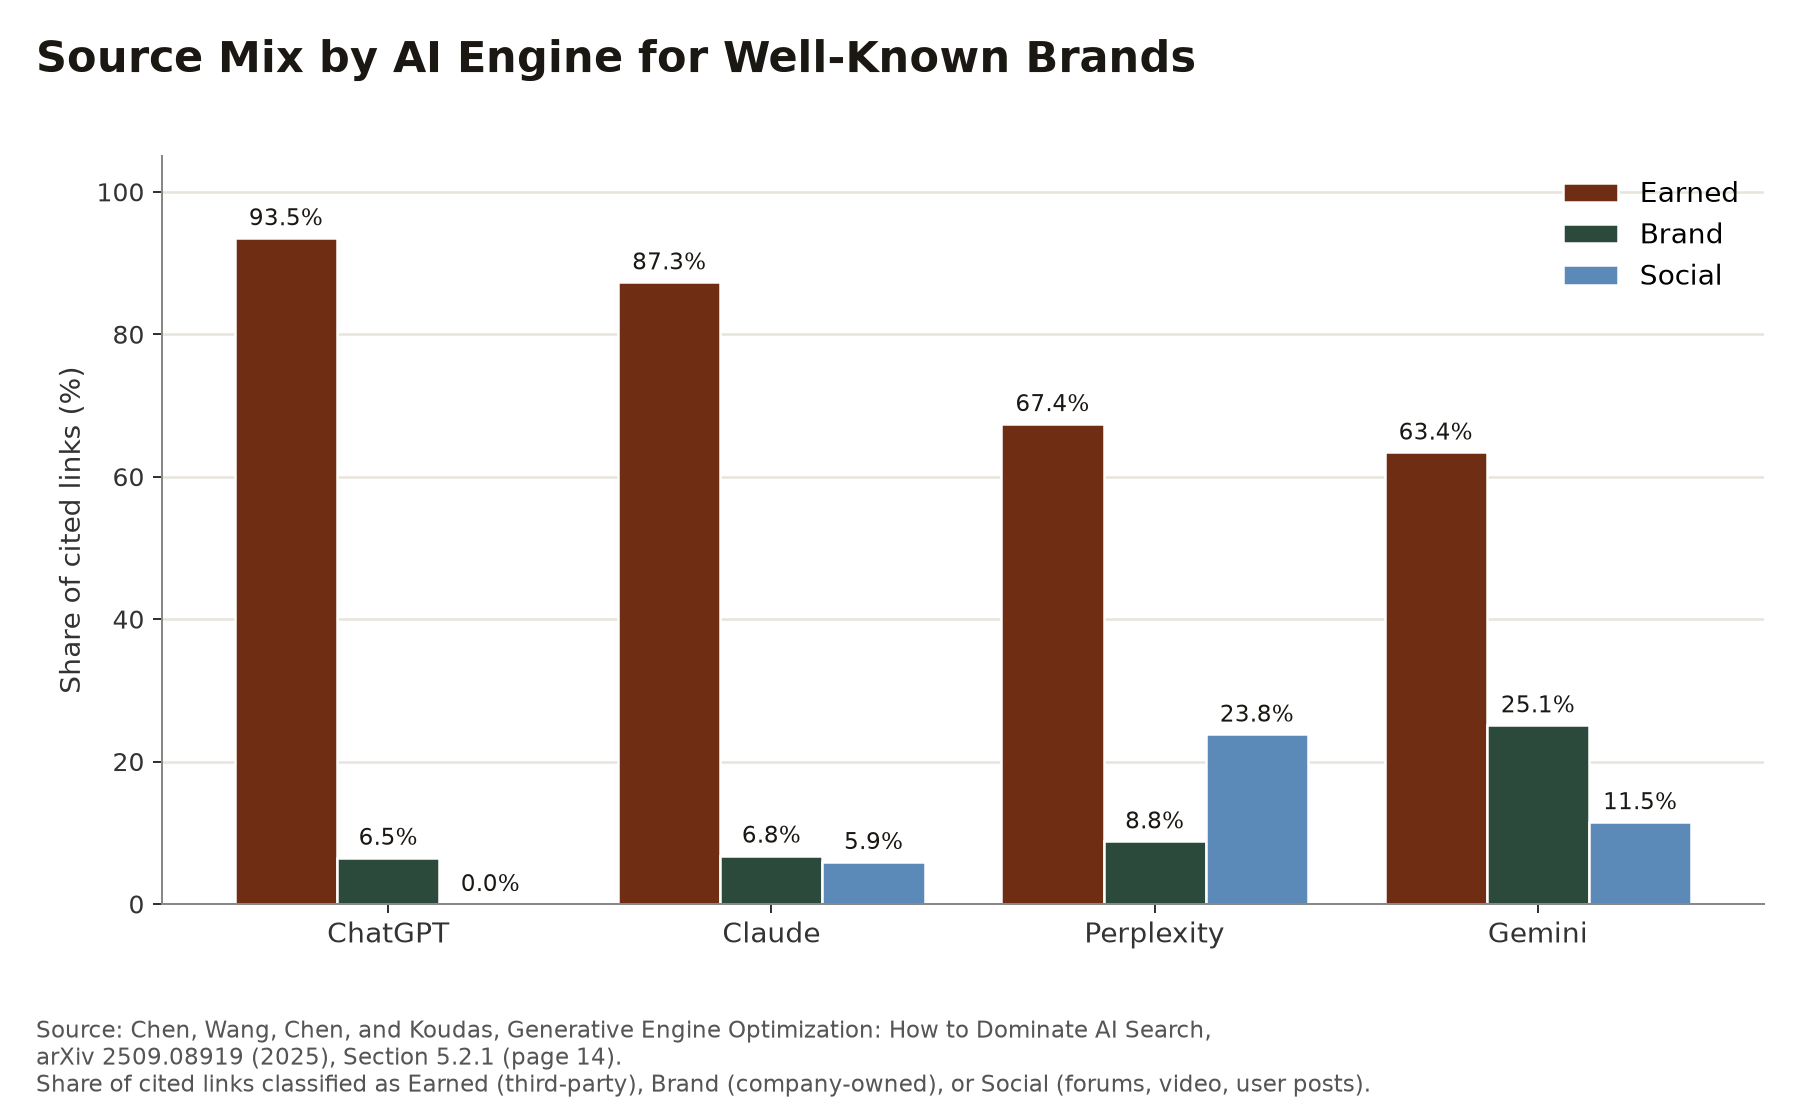
In a separate test, the four engines answered ranking questions about well-known brands and about niche brands, and the researchers sorted the links each engine cited (pages 13 and 14, Section 5.2.1).
Re-charted from Chen et al. Section 5.2.1.
The pattern held for niche brands, as the table below shows (page 15, Section 5.2.1).
| AI Engine | Earned | Brand | Social |
|---|---|---|---|
| ChatGPT | 95.1% | 4.9% | 0% |
| Claude | 86.3% | 10.6% | 3.2% |
| Perplexity | 73.4% | 9.1% | 17.5% |
| Gemini | 66.4% | 21.2% | 12.7% |
- ChatGPT and Claude leaned hardest on earned sites, Perplexity cited the most social content, and Gemini cited the most company websites (pages 14 and 15, Section 5.2.1).
- Pairs of engines agreed on the same brand answer 76% to 81% of the time for well-known brands and 71% to 76% of the time for niche brands (page 15, Section 5.2.1).
- Each engine drew on its own pool of websites. For consumer electronics, Claude cited 242 distinct domains, GPT 179, and Perplexity 268, and GPT and Perplexity shared very few of them, with an overlap score of 0.088 (page 18, Section 5.2.4).
- Freshness varied by category. Claude's consumer electronics sources had a mean age of about 117 days, while its automotive sources averaged about 331 days, and only about 61% of those automotive links had a date the researchers could find (page 16, Section 5.2.2).
- Language mattered more than wording. Claude reused the same authority sites across languages, GPT switched to almost entirely different sites for each language, and rewording a question in the same language moved results much less than translating it (pages 9 to 11, Sections 4.2.3 and 4.2.4).
Big Brands and Unbranded Questions
The authors asked ChatGPT and Perplexity 50 questions about the most popular or best cola and soda brands, without naming any brand, and sorted every brand mentioned into major, niche, or other (pages 19 and 20, Section 5.2.6).
Re-charted from Chen et al. Section 5.2.6.
- Coca-Cola and Pepsi led both engines, with 78 and 44 mentions on ChatGPT and 107 and 58 on Perplexity (page 20, Section 5.2.6).
- The engines found their evidence in different places. About 19.7% of ChatGPT's citations went to Wikipedia, while YouTube was Perplexity's most cited single site at about 8.9% (page 20, Section 5.2.6).
- In the bank test, Bankrate and NerdWallet were the most cited sites overall, and Gemini was the engine most likely to cite banks' own websites (page 22, Section 5.2.7).
Limits the Authors Note
The authors list several limits in Section 7 (pages 26 and 27).
- The data was collected in August 2025, and the AI services change often, so the percentages describe one moment in time and the study should be repeated.
- The three-group system for sorting sources is the authors' own, and the line between groups can be blurry. They say the absolute percentages show "strong, relative trends" and that the comparisons between engines are more reliable than the exact figures.
- The researchers had no access to the engines' internal data, so they can describe what the engines cite but can only infer why.
The paper is a preprint, and most of its results are shown as charts, with exact numbers given in the text only for some of them. The acknowledgments thank the team at ktau.ai, a company that works in generative engine optimization, for its support (page 27, Section 8).
What This Means for Brands in 2027 and Beyond
AI search engines lean on what other people say about a company. Reviews in respected publications, expert roundups, and comparison sites are the material these systems cite most, so coverage a brand earns from others carries more weight in AI answers than pages it publishes about itself.
The engines also differ enough that results on one tell you little about the others. A brand that shows up well in ChatGPT may be missing from Perplexity, which draws more on video and retailer pages, or from Gemini, which cites company websites more often. Local businesses and companies selling in more than one language face even wider gaps, since the cited sources shift more for local services and from one language to the next.
The tilt toward big names in unbranded questions means a smaller company has to give AI engines a reason to mention it, usually through coverage in the specialty publications of its niche. Make a list of the review sites and publications AI engines cite in your category, and work on getting your brand covered there.
Data Collection and Methodology
Our researchers read the public PDF of the paper (arXiv 2509.08919v1) and took every figure in this article from the paper's own text. Most of the paper's results appear only as charts, so we used only the numbers the authors state in the text. Page numbers refer to that PDF, which has no printed page numbers.
The earned-media chart uses the shares stated in Section 4.2.1. The paper does not state Google's earned share for consumer electronics in the United States, so we computed it as 100% minus the stated 32.9% brand and 15.4% social shares. The paper states ChatGPT's niche brand answers excluded social sources completely, which we show as 0%. The other charts and the table use the values stated in Sections 4.2.2, 5.2.1, and 5.2.6.
The charts were redrawn as sorted bars and grouped bars so the results are easier to read than the original academic layout. A CSV of the charted values is linked under Sources.
Sources
- Top GEO Agencies, The AI Search vs. Google Paper, Explained, October 2026, New York, New York. Download the data (CSV).
- Generative Engine Optimization: How to Dominate AI Search. Mahe Chen, Xiaoxuan Wang, Kaiwen Chen, and Nick Koudas. University of Toronto. Preprint, September 2025. arXiv 2509.08919.