Marketing Agency Revenue per Employee Benchmarks: 2026 Report
Published October 18, 2026
Revenue per employee is a common way to judge how productive a marketing agency group is, and publicly traded groups such as Omnicom, IPG and Stagwell report both their revenue and the number of people they employ. However, headline revenue includes the media and production costs that agencies pay to outside suppliers and bill on to clients, so it makes the groups that pass more of those costs through their accounts look more productive per person. Taking those costs out changes how the groups compare with one another.
Our analysts studied the annual filings of 12 publicly traded agency groups, from Omnicom, IPG and Stagwell to WPP, Publicis Groupe, Dentsu, S4 Capital, Next 15 and M&C Saatchi, and calculated both revenue per employee and net revenue per employee, which leaves those pass-through costs out.
In the following sections, we compare groups by company and size, show the change from 2024 to 2025, and track the holding companies' figures since 2019.
Marketing Agency Revenue per Employee by Company
Revenue and net revenue per employee were calculated for each group's latest fiscal year.
The figures are converted to US dollars, so groups that report in pounds, euros, yen and won can be compared directly. Omnicom and IPG share one row, because Omnicom acquired IPG in November 2025 and its annual report gives the two companies' combined revenue for the full year, so the 12 groups appear in 11 rows.
| Company | Fiscal Year | Revenue | Net Revenue | Headcount | Headcount Basis | Revenue per Employee | Net Revenue per Employee |
|---|---|---|---|---|---|---|---|
| Stagwell | 2025 | $2,909.0M | $2,427.7M | 10,951 | Year-end, full-time | $265,600 | $221,700 |
| Cheil Worldwide | 2025 | $3,198.9M | $1,308.5M | 7,993 | Year-end | $400,200 | $163,700 |
| Next 15 | Ended Jan. 2026 | $814.3M | $592.1M | 3,681 | Average | $221,200 | $160,900 |
| Publicis Groupe | 2025 | $19,671.3M | $16,446.8M | 114,079 | Year-end | $172,400 | $144,200 |
| M&C Saatchi | 2025 | $458.3M | $277.0M | 1,968 | Average | $232,900 | $140,700 |
| Havas | 2025 | $3,293.4M | $3,146.5M | 22,957 | Average | $143,500 | $137,100 |
| S4 Capital | 2025 | $995.7M | $887.8M | 6,744 | Average | $147,600 | $131,600 |
| WPP | 2025 | $17,875.2M | $13,424.2M | 103,277 | Average | $173,100 | $130,000 |
| Dentsu | 2025 | $9,595.9M | $8,006.6M | 67,454 | Year-end | $142,300 | $118,700 |
| Hakuhodo DY | Ended March 2026 | $5,756.6M | $2,714.7M | 28,921 | Year-end, excluding temporary staff | $199,000 | $93,900 |
| Omnicom and IPG (pro forma) | 2025 | $26,480.7M | Not disclosed | 120,000 | Year-end | $220,700 | Not disclosed |
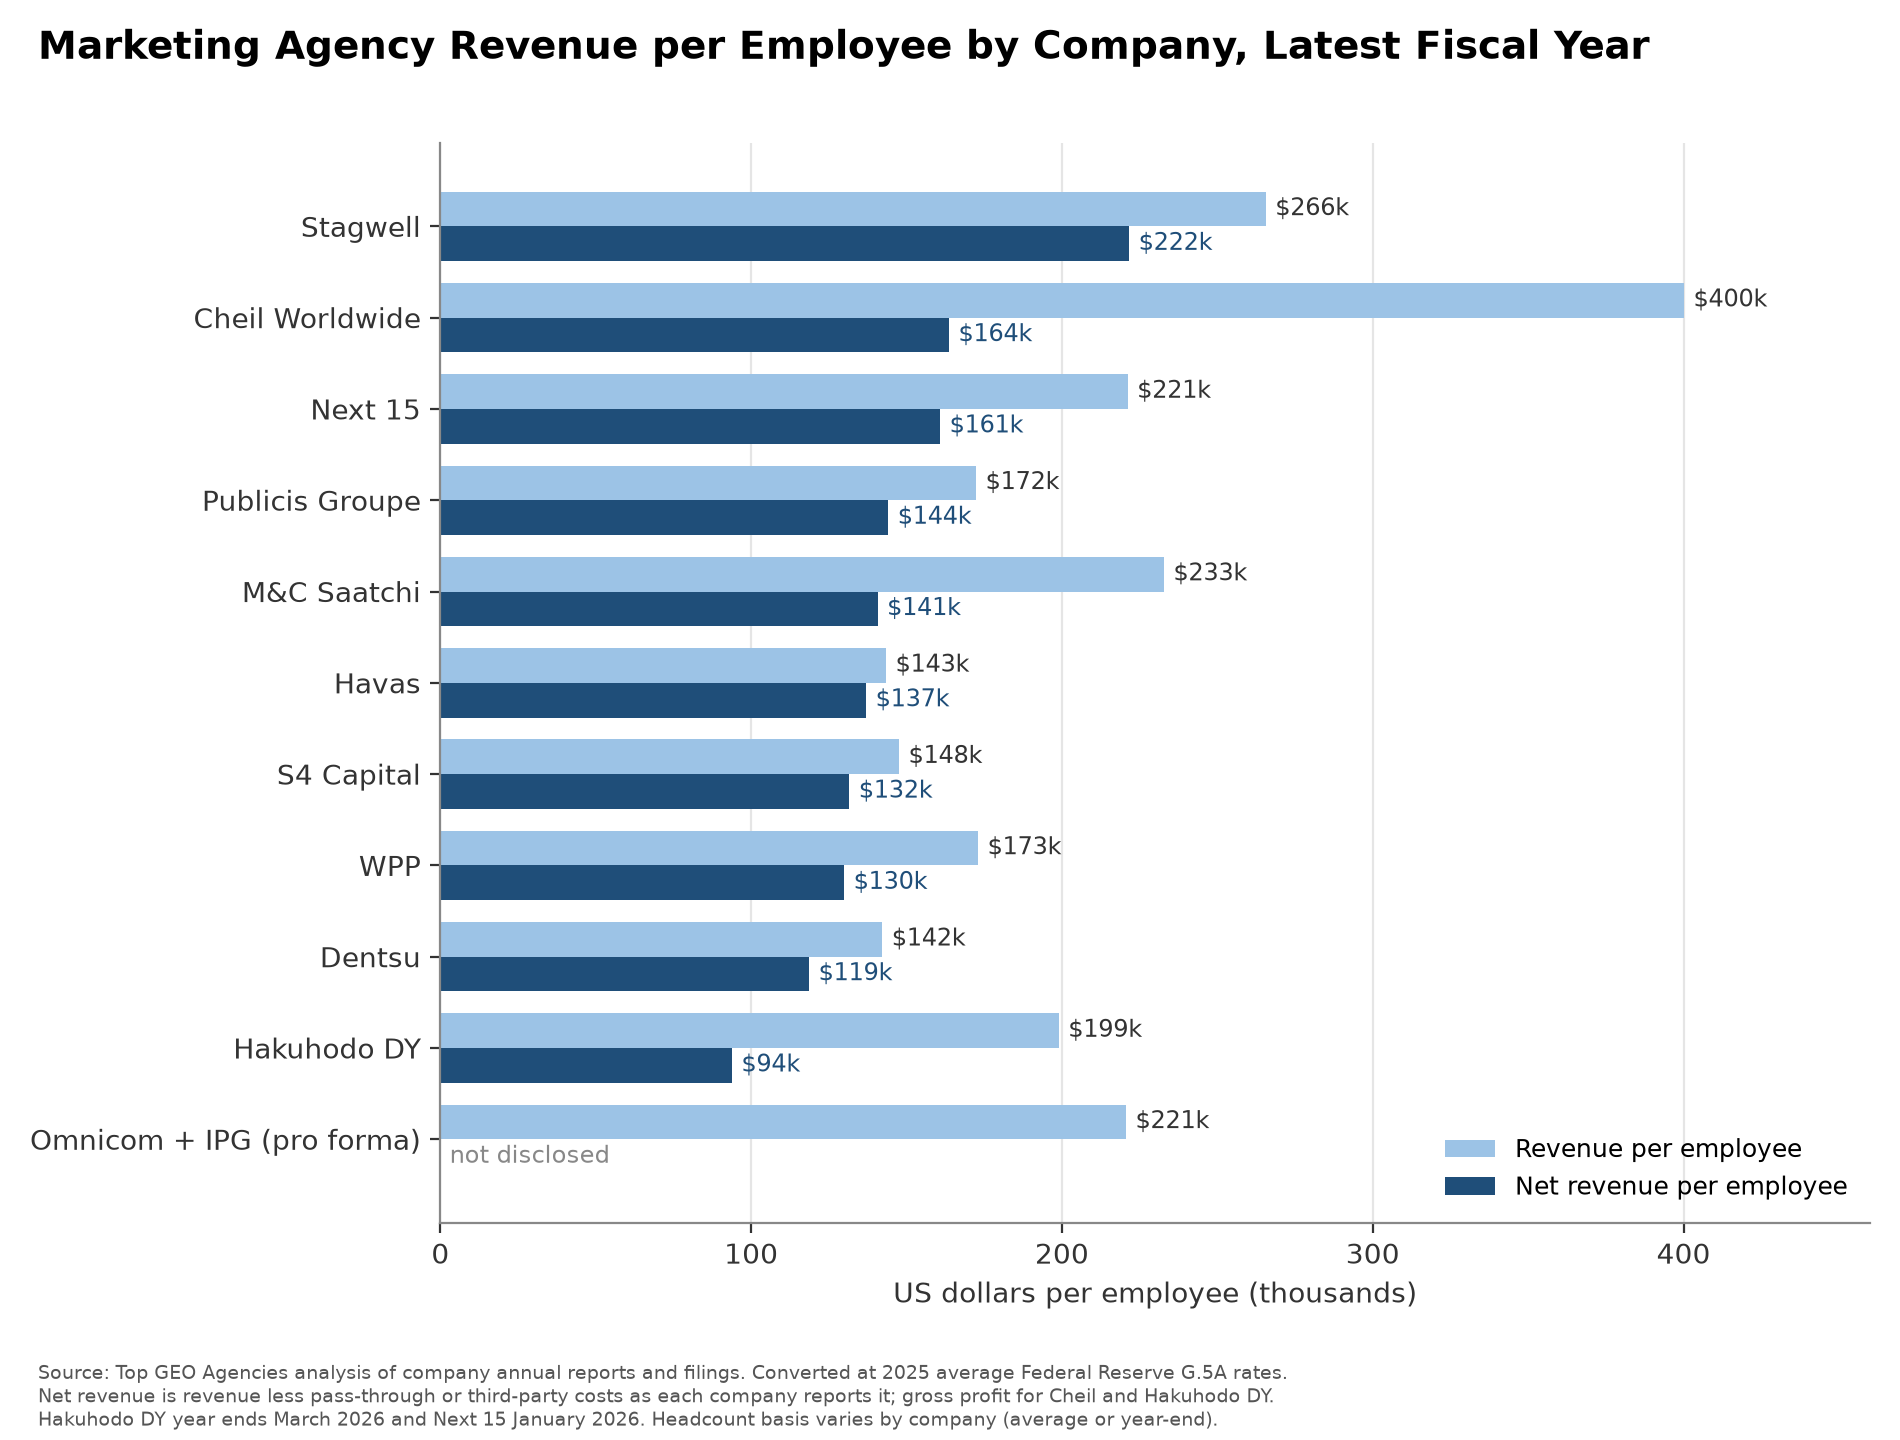
- The median net revenue per employee across the 10 companies that report a net figure is $138,900, the midpoint between Havas and M&C Saatchi. The range runs from $93,900 at Hakuhodo DY to $221,700 at Stagwell. The median revenue per employee across all 11 companies is $199,000, which is Hakuhodo DY's figure.
- Cheil Worldwide has the highest revenue per employee at $400,200, and its gross profit was 40.9% of revenue, the lowest share in the group. Hakuhodo DY's gross profit was 47.2% of revenue. At Havas, net revenue was 95.5% of revenue, so its two figures are almost the same.
- Agencies benchmarking themselves need to match the headcount basis first. Stagwell's $221,700 falls to $192,200 if contractors and part-time staff are counted. That $29,500 difference is larger than the gap between most groups that sit next to each other in the table, so future comparisons with these figures will only hold if staff are counted the same way.
Net Revenue per Employee by Agency Group Size
Agency size is one of the first things a client notices, so it is fair to ask whether the biggest groups earn more for each person they employ.
Grouping the 10 companies that report net revenue by size, five with more than 20,000 employees and five with fewer than 15,000, shows how the largest holding companies compare with smaller publicly traded groups on revenue per employee. Omnicom and IPG are left out because the combined company has no net revenue figure.
| Size Group | Companies | Median Revenue per Employee | Median Net Revenue per Employee | Lowest Net Revenue per Employee | Highest Net Revenue per Employee |
|---|---|---|---|---|---|
| More than 20,000 employees | WPP, Publicis Groupe, Dentsu, Havas, Hakuhodo DY | $172,400 | $130,000 | $93,900 (Hakuhodo DY) | $144,200 (Publicis Groupe) |
| Fewer than 15,000 employees | Stagwell, Cheil Worldwide, Next 15, M&C Saatchi, S4 Capital | $232,900 | $160,900 | $131,600 (S4 Capital) | $221,700 (Stagwell) |
- The five smaller groups have a median net revenue per employee $30,900 higher than the five largest. Publicis Groupe, at $144,200, ranks above two of the five smaller groups, M&C Saatchi and S4 Capital.
- Being larger brings no productivity edge in this group of companies. Publicis Groupe is the only one of the five largest groups with net revenue per employee above the $138,900 median for all 10 companies.
Change in Agency Revenue per Employee, 2024 to 2025
Several agency groups cut staff or sold businesses in the past year, and the year-over-year change shows whether that raised what each employee brings in.
Comparing each company's latest fiscal year with the year before, in US dollars at the 2025 average exchange rate for both years so that exchange rates do not affect the changes, shows whether revenue per employee moved because of revenue or because of headcount.
| Company | Headcount Change | Revenue Change | Net Revenue Change | Revenue per Employee Change | Net Revenue per Employee Change |
|---|---|---|---|---|---|
| Stagwell | -7.6% | +2.4% | +5.7% | +10.9% | +14.4% |
| Next 15 | -12.7% | -3.4% | -6.3% | +10.6% | +7.3% |
| Hakuhodo DY | -1.6% | -9.7% | +1.6% | -8.2% | +3.2% |
| Havas | +0.2% | +1.7% | +1.7% | +1.5% | +1.5% |
| Dentsu | -1.0% | +1.7% | -0.3% | +2.7% | +0.6% |
| Cheil Worldwide | +7.5% | +4.7% | +7.7% | -2.7% | +0.1% |
| S4 Capital | -10.1% | -11.0% | -10.8% | -1.1% | -0.8% |
| Publicis Groupe | +5.5% | +8.5% | +4.2% | +2.9% | -1.2% |
| WPP | -7.2% | -8.1% | -10.4% | -1.0% | -3.5% |
| M&C Saatchi | -0.8% | -12.1% | -9.3% | -11.5% | -8.6% |
| Omnicom and IPG (pro forma) | -6.4% | +0.4% | Not disclosed | +7.2% | Not disclosed |
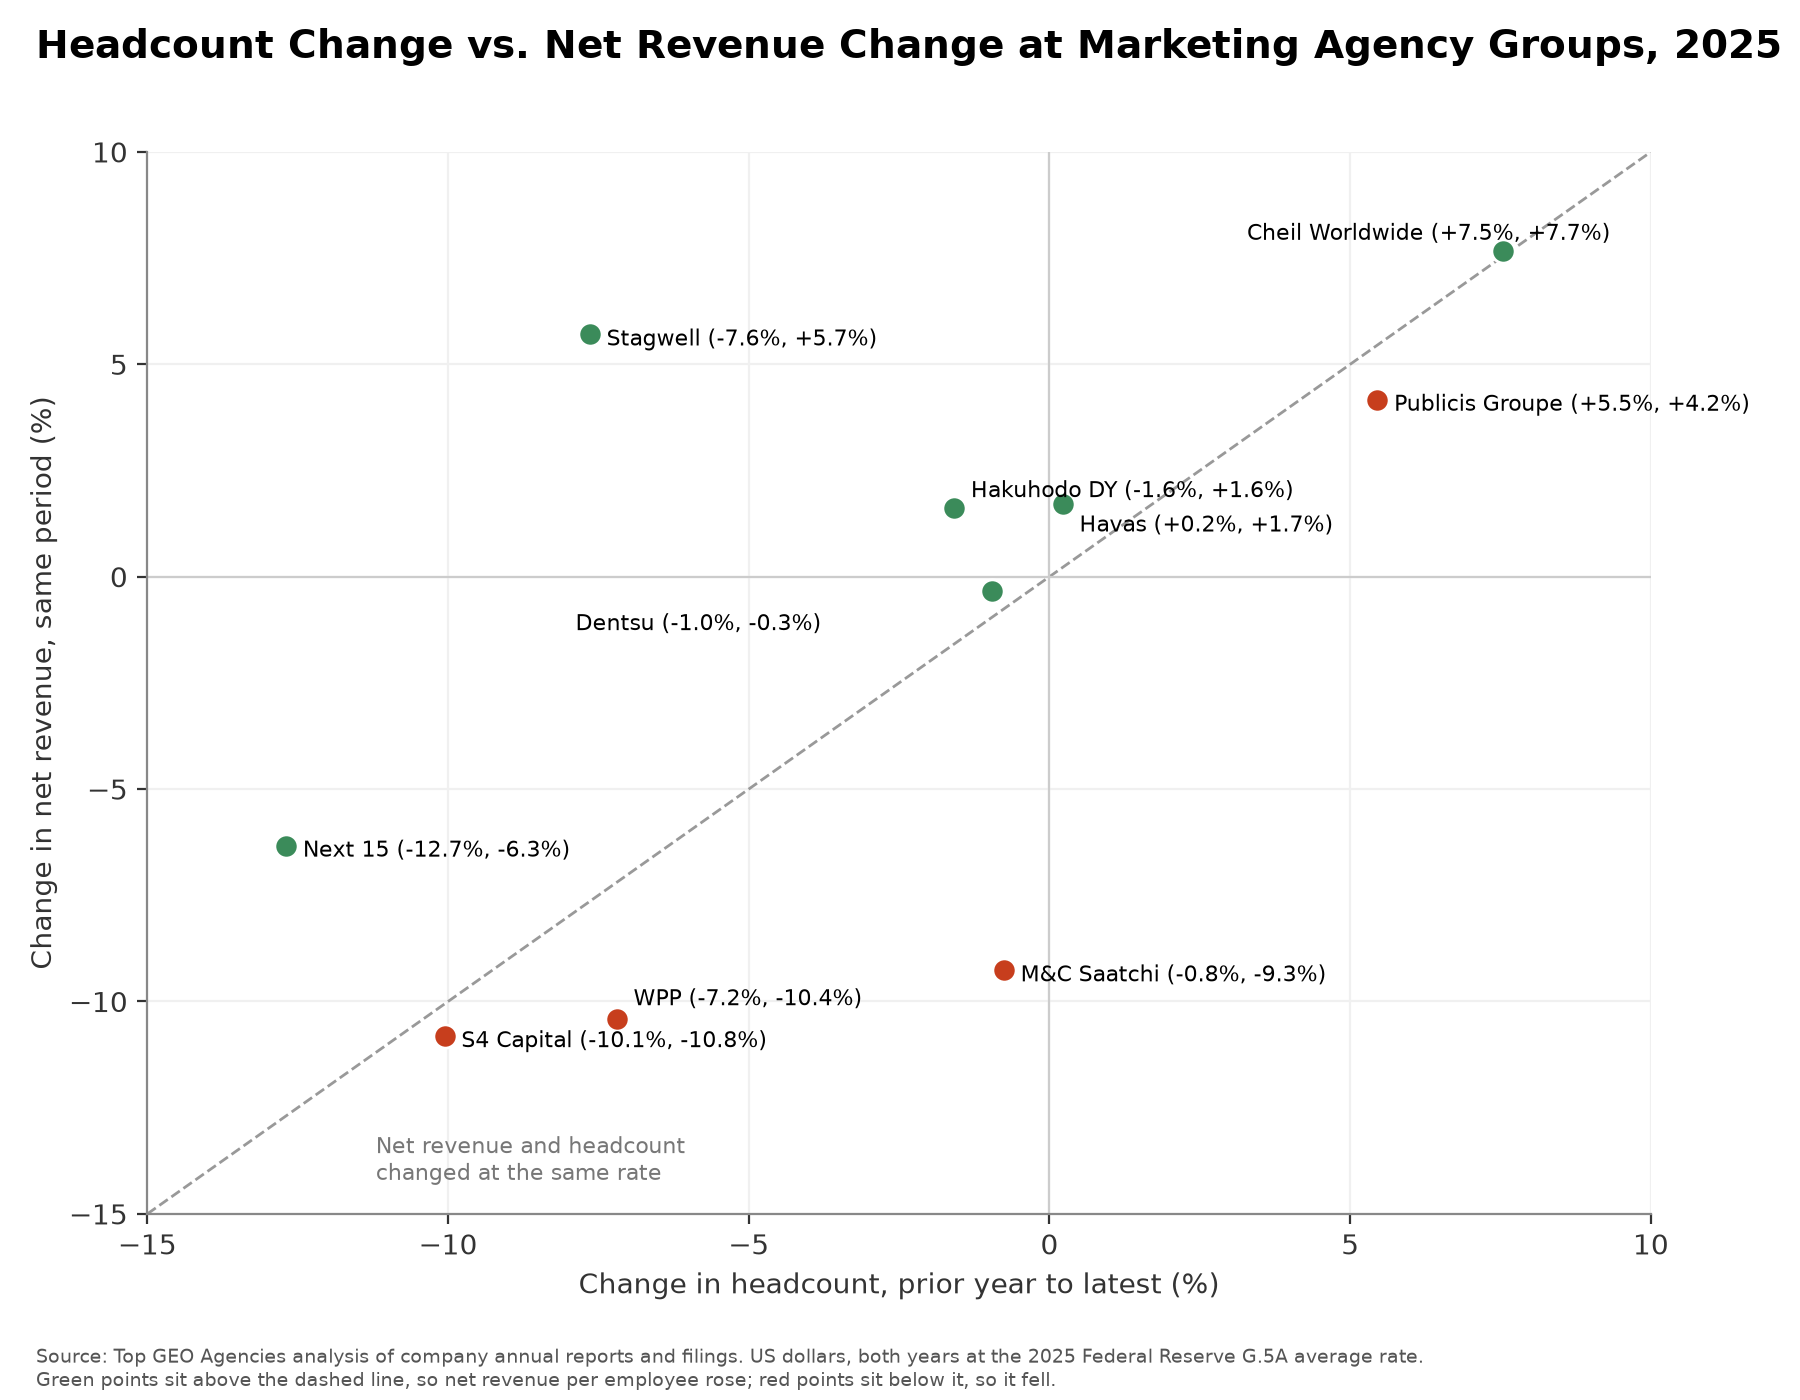
- Net revenue per employee rose at six of the 10 companies and fell at four. Stagwell had the largest increase, 14.4%, with net revenue up 5.7% while its full-time headcount fell 7.6%. M&C Saatchi had the largest decline, 8.6%, with net revenue down 9.3% and average staff almost unchanged.
- WPP's average headcount fell 7.2% and its reported revenue less pass-through costs fell 10.4%, a figure that includes the sale of FGS Global and currency movements. WPP's annual report puts the like-for-like decline at 5.4% and says headcount from the start of the year fell 8.7%, along with less use of freelancers. Next 15's results statement says it cut headcount from 3,992 to 3,350 and reduced its portfolio from 22 businesses to 11.
- Several groups raised output per person by cutting staff. Omnicom and IPG combined kept revenue up 0.4% on about 8,200 fewer employees, which lifted their revenue per employee 7.2%.
Net Revenue per Employee Trend at Agency Holding Companies, 2019 to 2025
A longer view, back to before the pandemic, shows whether the holding companies have grown more productive per person over several years.
Net revenue per employee at the holding companies can be followed back to 2019, in US dollars at the 2025 average exchange rate, for every year that a company's filings report on a consistent basis. IPG's last annual report covers 2024. Dentsu's five-year summary begins in 2021, and Stagwell's and S4 Capital's comparable figures begin in 2022.
| Year | WPP | Publicis Groupe | Omnicom (Calculated) | IPG | Dentsu | Stagwell | S4 Capital |
|---|---|---|---|---|---|---|---|
| 2019 | $134,343 | $133,116 | $155,381 | $158,842 | - | - | - |
| 2020 | $125,246 | $138,902 | $153,654 | $160,647 | - | - | - |
| 2021 | $130,867 | $133,926 | $151,442 | $163,811 | $100,711 | - | - |
| 2022 | $136,387 | $145,007 | $150,419 | $161,805 | $108,374 | $200,194 | $134,101 |
| 2023 | $136,364 | $143,374 | $147,613 | $163,774 | $107,612 | $209,429 | $137,560 |
| 2024 | $134,657 | $145,951 | $156,182 | $172,375 | $117,971 | $193,697 | $132,764 |
| 2025 | $129,982 | $144,171 | - | - | $118,697 | $221,685 | $131,646 |
| Change, first to last year | -3.2% | +8.3% | +0.5% | +8.5% | +17.9% | +10.7% | -1.8% |
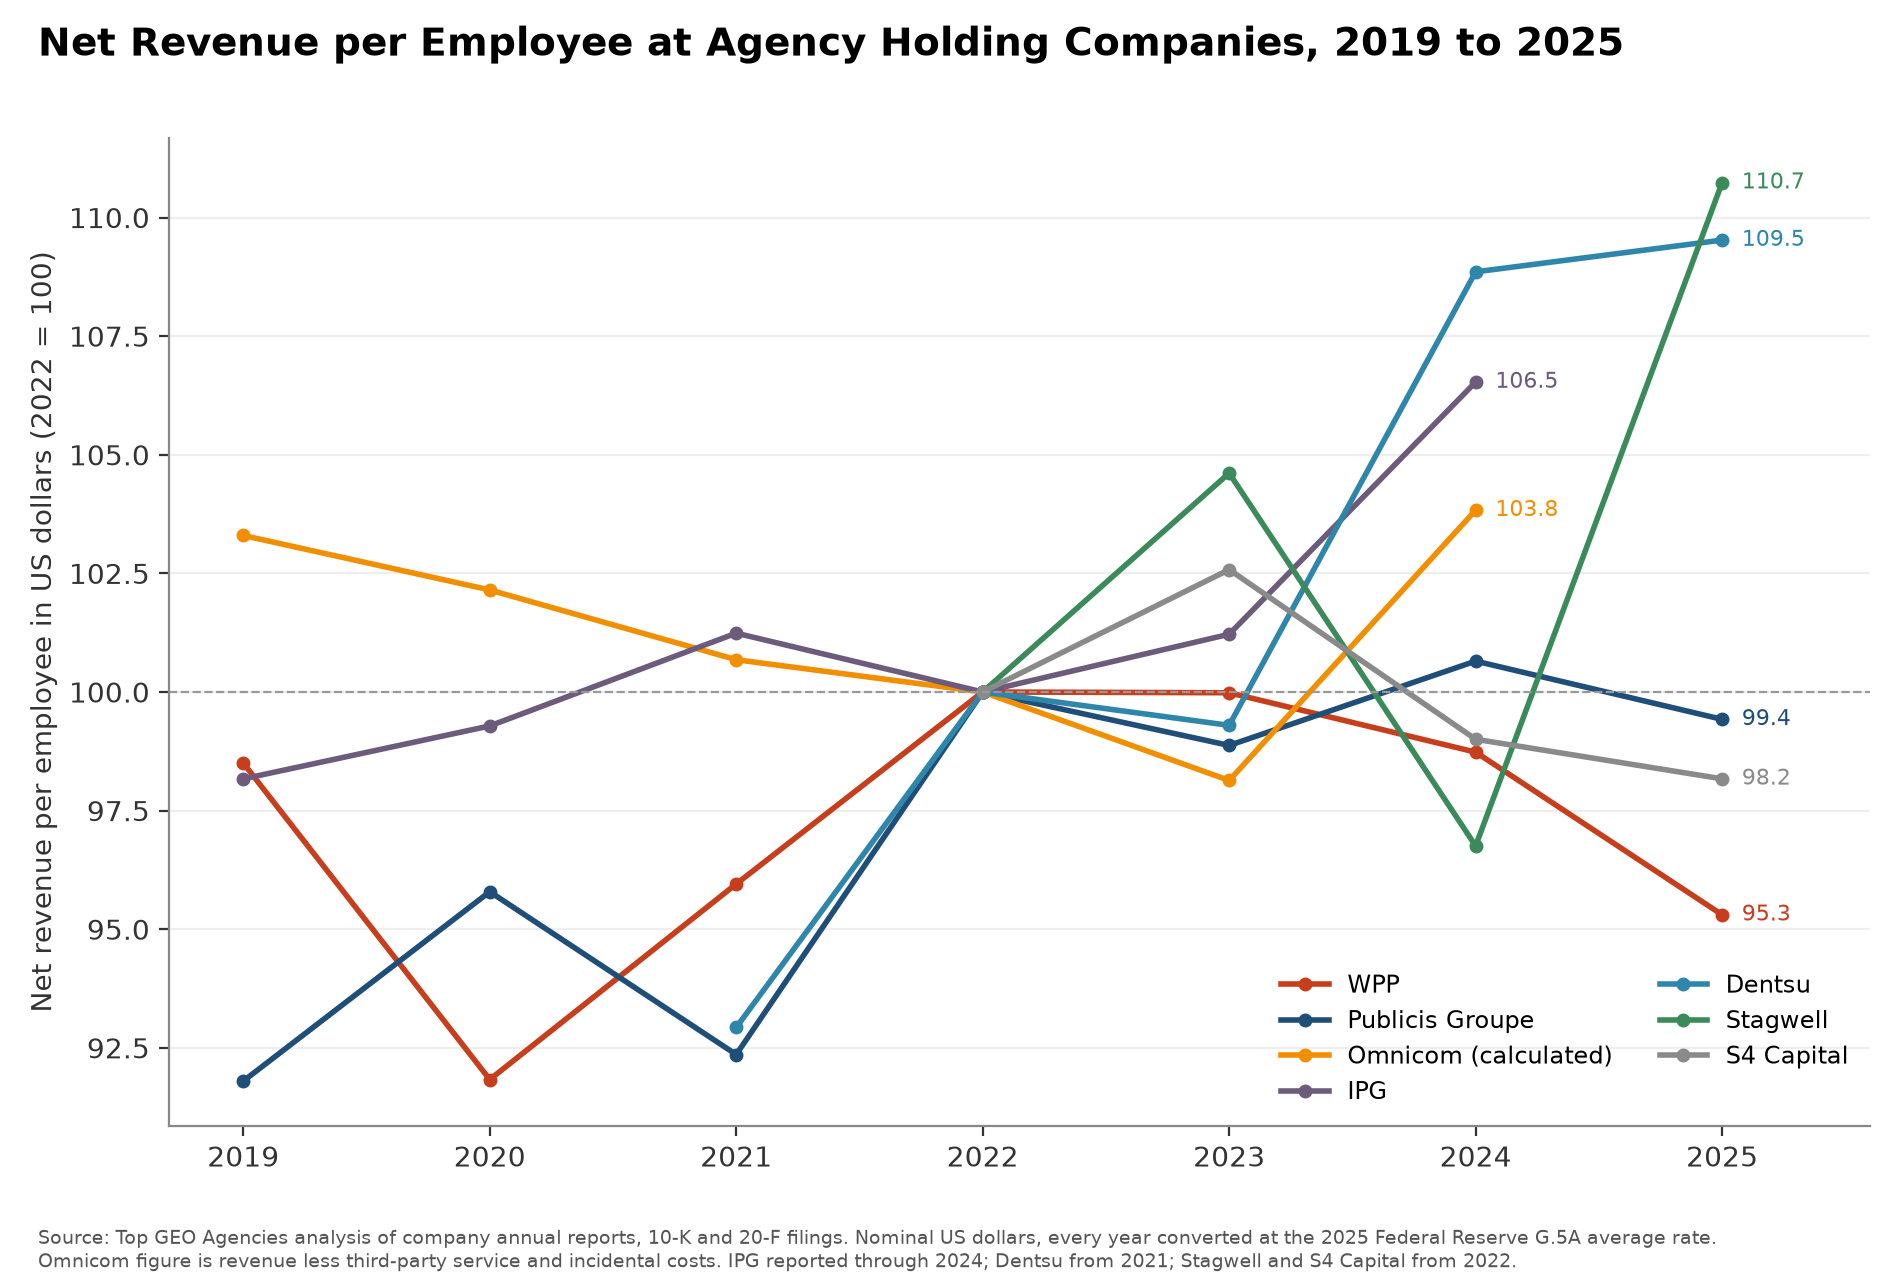
- Omnicom's net revenue per employee rose 0.5% from 2019 to 2024 and IPG's rose 8.5%. The US consumer price index rose 22.7% between the 2019 and 2024 annual averages, so in 2019 dollars Omnicom's 2024 figure was 18.1% lower than in 2019 and IPG's was 11.6% lower.
- WPP's net revenue per average employee was 3.2% lower in 2025 than in 2019, at $129,982. Its revenue per average employee rose 5.6% over the same years to $173,080, which matches the revenue per employee of about $172,800 that WPP reports as one of its own performance measures.
- Any growth comparison with Omnicom or IPG needs to be adjusted for inflation first.
Revenue per Employee Trend at Agency Holding Companies, 2019 to 2025
Some agency groups quote total revenue per employee as a headline figure, so it is worth seeing how that measure has moved alongside the net figure.
Total revenue includes the media and production costs that agencies pass through to suppliers, so revenue per employee can rise even when net revenue per employee does not.
| Year | WPP | Publicis Groupe | Omnicom | IPG | Dentsu | Stagwell | S4 Capital |
|---|---|---|---|---|---|---|---|
| 2019 | $163,917 | $149,429 | $213,624 | $188,238 | - | - | - |
| 2020 | $153,995 | $154,292 | $205,477 | $180,498 | - | - | - |
| 2021 | $161,126 | $149,902 | $199,294 | $184,185 | $111,953 | - | - |
| 2022 | $166,779 | $163,739 | $192,575 | $187,120 | $120,657 | $242,143 | $160,840 |
| 2023 | $170,687 | $162,013 | $193,573 | $189,709 | $122,627 | $246,554 | $159,347 |
| 2024 | $174,749 | $167,532 | $209,467 | $200,595 | $138,521 | $239,624 | $149,232 |
| 2025 | $173,080 | $172,436 | $220,672 (pro forma, with IPG) | - | $142,258 | $265,638 | $147,648 |
| Change, first to last year | +5.6% | +15.4% | -1.9% (2019 to 2024) | +6.6% | +27.1% | +9.7% | -8.2% |
- Revenue per employee rose faster than net revenue per employee at WPP, Publicis Groupe and Dentsu, because pass-through costs grew as a share of their revenue. WPP's revenue less pass-through costs was 82.0% of revenue in 2019 and 75.1% in 2025.
- Total revenue per employee is inflated by pass-through costs, so it can rise while the net figure falls, as it did at WPP.
Conclusion
A rising net revenue per employee figure in the latest fiscal year mostly reflected smaller staffs, so on its own it says little about whether an agency group won more work. Havas and Cheil Worldwide were the only groups that raised the figure while adding staff.
More broadly, headline revenue per employee overstates how productive an agency group is, and by a different amount at each group, because it counts the media and production costs passed through to suppliers. Net revenue per employee is the measure that can be compared from one group to the next. So if you compare agencies on revenue per employee, use the net revenue figure and check whether the headcount is an average or a year-end count.
Data Collection and Methodology
Agency groups report in different currencies and under different definitions, and a few of those details shape how far these figures can be compared.
Revenue, net revenue and headcount come from annual reports, 10-K and 20-F filings, Japanese and Korean annual securities reports, and year-end results presentations published by October 8, 2026. A company was included if it is publicly traded, earns most of its revenue from advertising, media, marketing or communications services, and discloses revenue and headcount for the same fiscal year. The figures cover each company's latest fiscal year and every earlier year back to 2019 that its filings report on a consistent basis. All money figures are converted to US dollars at the Federal Reserve's 2025 average exchange rates, and the same rates are used for every year, so the year-over-year changes and the multi-year trends reflect company performance rather than currency moves.
Net revenue per employee takes out the media, production and other third-party costs that agencies bill on to clients. Each company names and defines its net revenue figure differently, and the costs each one deducts are not identical. WPP reports revenue less pass-through costs, which are fees paid to outside suppliers that are charged directly to clients, mostly media costs. IPG reported revenue before billable expenses, Stagwell reports revenue less billable costs, and Dentsu, Cheil Worldwide and Hakuhodo DY report gross profit under each company's own accounting rules, which for Hakuhodo DY are Japanese accounting standards. Omnicom does not publish a net revenue figure, so its net revenue here is revenue minus the third-party service costs and third-party incidental costs in its income statement: the vendor costs it incurs when it acts as principal for a client, plus client travel and other incidental costs.
Headcount is the average for the year where the company reports one, which is the case for WPP, Havas, S4 Capital, Next 15 and M&C Saatchi, and the year-end count everywhere else. Stagwell's count covers full-time employees, and Hakuhodo DY's leaves out temporary staff, because that is how each company reports it.
Omnicom completed its acquisition of IPG on November 26, 2025, so Omnicom's reported 2025 revenue includes about one month of IPG while its year-end headcount of approximately 120,000 includes all of IPG's staff. Omnicom's 2025 figures use the unaudited pro forma revenue in its 10-K, which combines the two companies for the full year. Accenture Song was left out because Accenture reports its results by geographic market and does not disclose revenue or headcount for Song. YouGov was left out because it is a research company.
Average and year-end headcount can differ by several percent in a year of hiring or layoffs. WPP's year-end headcount of 98,655 would give it revenue per employee of $181,200 and net revenue per employee of $136,100, against $173,100 and $130,000 on its average headcount. Omnicom and IPG report headcount rounded to the nearest hundred. Next 15's average headcount includes its discontinued Mach49 business, while its revenue excludes it.
The 2025 rates are calendar-year averages and are also used for Hakuhodo DY and Next 15, whose fiscal years end in March and January 2026. The trend tables are nominal. All 12 companies are publicly traded groups with at least 1,968 employees, and the figures do not describe independent agencies with a few dozen staff.
Sources
- Top GEO Agencies, Marketing Agency Revenue per Employee Study: analysis of revenue, net revenue and headcount in the fiscal 2019 to 2025 annual reports, 10-K and 20-F filings, and annual securities reports of 12 publicly traded marketing agency groups, conducted October 2026. Download the data (CSV)
- WPP annual report on Form 20-F for 2025. WPP plc, March 19, 2026.
- WPP Annual Report and Accounts 2025. WPP plc, 2026. Source for the revenue per employee measure, like-for-like decline and headcount commentary.
- WPP annual report on Form 20-F for 2024. WPP plc, March 28, 2025.
- WPP annual report on Form 20-F for 2023. WPP plc, March 21, 2024.
- WPP annual report on Form 20-F for 2022. WPP plc, March 23, 2023.
- WPP annual report on Form 20-F for 2021. WPP plc, April 6, 2022.
- WPP annual report on Form 20-F for 2020. WPP plc, April 29, 2021.
- WPP annual report on Form 20-F for 2019. WPP plc, April 30, 2020. Figures are for continuing operations, excluding Kantar.
- Publicis Groupe 2025 Universal Registration Document. Publicis Groupe, April 30, 2026. Also the source for 2022 net revenue.
- Publicis Groupe 2023 Universal Registration Document. Publicis Groupe, 2024.
- Publicis Groupe 2021 Universal Registration Document. Publicis Groupe, April 25, 2022.
- Publicis Groupe 2020 Universal Registration Document. Publicis Groupe, April 9, 2021.
- Omnicom annual report for 2025. Omnicom Group, Form 10-K, February 20, 2026. Source for pro forma combined revenue with IPG.
- Omnicom annual report for 2024. Omnicom Group, Form 10-K, February 5, 2025.
- Omnicom annual report for 2023. Omnicom Group, Form 10-K, February 7, 2024.
- Omnicom annual report for 2022. Omnicom Group, Form 10-K, February 8, 2023.
- Omnicom annual report for 2021. Omnicom Group, Form 10-K, February 9, 2022.
- Omnicom annual report for 2020. Omnicom Group, Form 10-K, February 18, 2021.
- Omnicom annual report for 2019. Omnicom Group, Form 10-K, February 11, 2020.
- IPG annual report for 2024. Interpublic Group, Form 10-K, February 20, 2025.
- IPG annual report for 2023. Interpublic Group, Form 10-K, February 20, 2024.
- IPG annual report for 2022. Interpublic Group, Form 10-K, February 21, 2023.
- IPG annual report for 2021. Interpublic Group, Form 10-K, February 22, 2022.
- IPG annual report for 2020. Interpublic Group, Form 10-K, February 22, 2021.
- IPG annual report for 2019. Interpublic Group, Form 10-K, February 21, 2020.
- Stagwell annual report for 2025. Stagwell Inc., Form 10-K, March 13, 2026.
- Stagwell annual report for 2024. Stagwell Inc., Form 10-K, March 11, 2025.
- Stagwell annual report for 2023. Stagwell Inc., Form 10-K, March 11, 2024.
- Stagwell annual report for 2022. Stagwell Inc., Form 10-K, March 6, 2023.
- Dentsu Group annual securities report for fiscal 2025. Dentsu Group Inc., March 26, 2026. In Japanese; source for the 2021 to 2025 five-year summary and headcount.
- Dentsu Group financial report for fiscal 2025. Dentsu Group Inc., 2026.
- Havas 2025 Annual Report. Havas N.V., March 2026.
- S4 Capital Annual Report and Accounts 2025. S4 Capital plc, April 2026.
- S4 Capital Annual Report and Accounts 2023. S4 Capital plc, April 2024.
- Next 15 Group Annual Report 2026. Next 15 Group plc, 2026.
- Next 15 Group final results for the year ended January 31, 2026. Next 15 Group plc, 2026. Source for the headcount and portfolio reductions.
- M&C Saatchi Annual Report and Accounts 2025. M&C Saatchi plc, April 23, 2026.
- Cheil Worldwide business report for fiscal 2025. Cheil Worldwide, filed with the Korea Exchange, March 10, 2026. In Korean.
- Cheil Worldwide fourth quarter and full year 2025 results. Cheil Worldwide, February 2, 2026. In Korean; source for headcount.
- Hakuhodo DY Holdings annual securities report for the year ended March 31, 2026. Hakuhodo DY Holdings, EDINET filing, June 25, 2026. In Japanese.
- Accenture annual report for fiscal 2025. Accenture plc, Form 10-K, 2025. Used for the reason Accenture Song is excluded.
- Foreign Exchange Rates, G.5A annual release. Board of Governors of the Federal Reserve System, January 5, 2026. 2025 annual average exchange rates, used for every year in this report.
- Consumer Price Index for All Urban Consumers, US city average, all items (CUUR0000SA0). US Bureau of Labor Statistics. Annual averages of 255.657 for 2019 and 313.689 for 2024.