The LIVE-GEO Paper, Explained
Published November 12, 2026
Researchers who study generative engine optimization, the practice of rewriting web content so that AI tools such as ChatGPT and Gemini recommend it more often, usually test their rewriting methods in a lab. They paste the rewritten text straight into an AI model next to a fixed set of competing pages, or they build their own small search system, and then they measure how often the model favors the rewrite. A real AI search engine works differently. It visits pages on the open web through its own retrieval system, which outsiders cannot see. That leaves open whether a method that wins in the lab still wins when a real engine reads a real web page, and a team of researchers from the University of Illinois Urbana-Champaign and the University of Michigan built a public website to find out.
Our researchers read Do GEO Gains Survive the Live Web? Evaluating In-the-Wild Visibility Gains of Generative Engine Optimization via LIVE-GEO, a paper by Runze Kong, Haibo Jin, Xucheng Yu, Xiaoqi Wang, Huimin Zeng, and Haohan Wang, and wrote this report to explain its findings in simple terms and what they mean for brands. The paper was posted to arXiv on October 31, 2026. The authors invented 80 brands, published six versions of each brand's product page on a live website, and rewrote five of those versions with five published optimization methods. They then asked ChatGPT, Grok, and Gemini to open the pages and rank the six versions, and they compared those rankings with the rankings from five AI models that were given the same text directly.
In the following sections, we explain how the experiment worked, what the authors concluded, which method won on each AI engine, how often the engines agreed with each other, how the order of the links changed the results, how small changes to prices and page access affected rankings, what happened to rewrites that made up numbers, and the limits to keep in mind.
The Main Experiment
The authors wanted a test in which the only difference between competing pages was the way their text was written. So they gave each brand six products with identical specifications, wrote each product page in a different way, and asked AI engines which product was best.
Building the fictional products
The authors created 80 fictional brands, each in an unusual product category, so that no real brand or existing web page could interfere with the results. The categories fall into 18 product families, such as drying and dehydration equipment, archival and conservation equipment, and water treatment and distillation apparatus. Two of the categories were a brine-mist fogponic rack and an active-layer thaw-bed planter. A computer program filled in each product's specifications and wrote a plain Original description and seven customer reviews based on them.
Five optimization methods from earlier research then rewrote each brand's description and the titles and text of its seven reviews, while the specifications, the review ratings, and the review authors stayed the same. Each brand therefore had six products: the Original and one rewrite from each method. Every product had its own page on a live public website, run as the product site of a startup partner, so AI engines could reach it the same way they reach any commercial site. In the main test, the rewritten products were priced at random within 0.2% of the brand's base price.
| Version | How its text was written | Descriptions flagged for unsupported numbers (of 80) |
|---|---|---|
| Original | Generated by the authors from templates, using only the product's specifications | Not checked |
| Statistics Addition | Adds statistics to the text to sound more convincing; the prompt allows made-up figures | 80 |
| C-SEO | Applies several content improvements at once, following the C-SEO Bench study | 0 |
| E-GEO | Repeatedly improves the rewriting instructions to push the product higher in rankings | 2 |
| AgenticGEO | Uses a stand-in judge model to predict what an AI engine prefers and searches for rewriting strategies | 3 |
| CORE | Adds text to the page and revises it based on the gap between the product's observed rank and its target rank | 1 |
Key Findings
- Statistics Addition comes from the 2024 paper that introduced generative engine optimization, and C-SEO comes from the C-SEO Bench study. E-GEO, AgenticGEO, and CORE are more recent methods that use feedback on rankings or on what AI engines prefer.
- CORE was developed by a team that includes three of this paper's authors, Haibo Jin, Huimin Zeng, and Haohan Wang. In a final round of its optimization, the authors fed ChatGPT's rankings of CORE's losing products back into CORE before freezing the text, so CORE was the only method tuned with feedback from one of the engines being tested.
Asking the AI engines to rank
For each brand, the authors gave an AI engine the links to the six product pages and asked for the best product in the category, in the form "best" followed by the category name. The instructions told the engine to open every page, read the description and all of the customer reviews, rank the six products from best to worst, and report how much of each page it had read. In another version of the test, the engine received a single link to the brand's page and had to find the six products itself. The brand page listed the products in a new random order every time it loaded.
The authors compared three AI search engines with five AI models that never visited the website. Those five models received the same descriptions and reviews pasted in as text, which is how most earlier lab studies measured these methods.
| Evaluator | Type | How it saw the six products |
|---|---|---|
| ChatGPT (GPT-6) | AI search engine | Opened the live product pages from links |
| Gemini (3.6 Thinking) | AI search engine | Opened the live product pages from links |
| Grok (Expert mode) | AI search engine | Opened the live product pages from links |
| GPT-4o | Model through its API | Read the descriptions and reviews as text |
| DeepSeek-V4-Pro | Model through its API | Read the descriptions and reviews as text |
| Kimi K2.6 | Model through its API | Read the descriptions and reviews as text |
| Claude Sonnet 5.5 | Model through its API | Read the descriptions and reviews as text |
| Qwen2.5-3B-Instruct | Small model run on the authors' own computer | Read the descriptions and reviews as text |
Key Findings
- All three AI search engines returned complete rankings for all 80 brands when given the product links.
- The Claude API refused to rank 2 of the 80 brands, so its results cover 78 brands.
How the authors measured a win
The main measure is the first-place rate: the share of brands for which a version was ranked first out of six. The authors also report each version's average rank, where 1 is the best possible and 6 is the worst. To see whether two rankings agreed, they counted how often both picked the same top product for a brand. They also froze each set of pages, so the content could not change between measurements, and they shuffled each brand's six links once and kept that order for repeat runs.
What the Paper Concluded
The authors conclude that part of the gain from optimization survives on the live web and most of it does not. Seven of the eight evaluators, including all three AI search engines, ranked CORE's rewrite first more often than any other version. But that agreement held only across all 80 brands taken together. Brand by brand, the three engines often picked different winners, and the models that read the text directly often disagreed with the engines. So a method can come out ahead on average across many products and still lose on a particular product.
The authors also found that the order in which the links were listed, the visible names of the versions, and the way the engine reached the pages all changed the results. Rewrites that won by adding made-up numbers lost every first place once those rewrites were moved below the others. Based on these results, the authors present LIVE-GEO as a public testing site, where anyone can download the Original product records, rewrite them with their own method, upload the result without creating an account, and measure how real AI engines rank it against the same frozen set of products.
Which Method Won on Each AI Engine
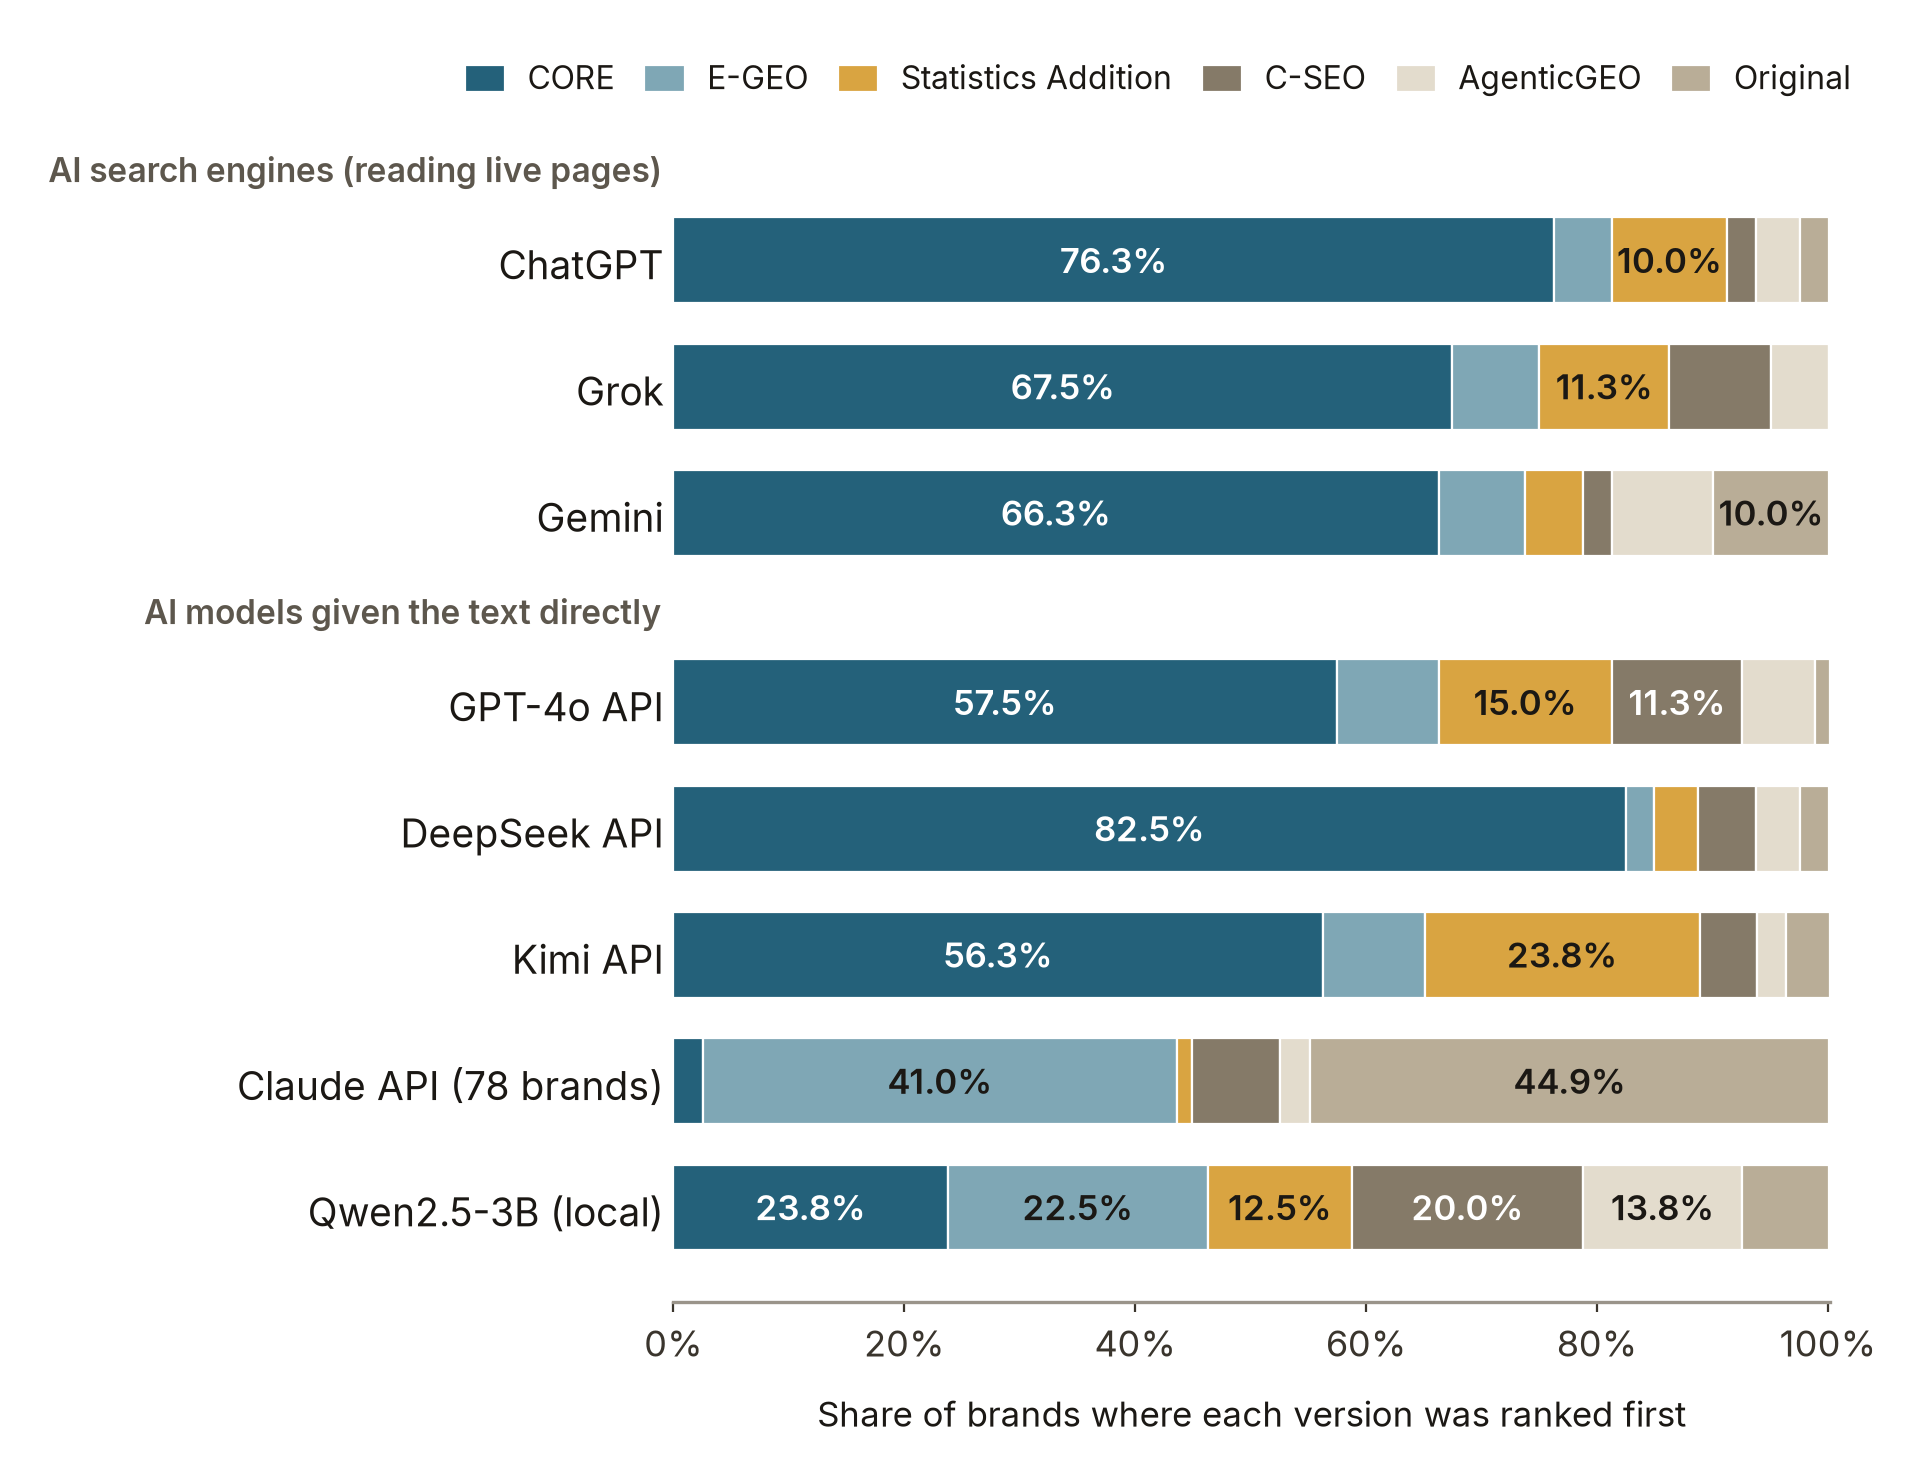
We start with the main test, with prices within 0.2% of each other and the search engines given the product links. For each evaluator, we compared the share of brands where each version was ranked first.
Key Findings
- CORE was ranked first for 76.3% of brands on ChatGPT, 67.5% on Grok, and 66.3% on Gemini. On all three engines, its lead over the next-best version was between 56 and 66 percentage points.
- The Claude API was the one exception. It ranked the Original page first for 44.9% of brands and E-GEO first for 41.0%, and it put CORE last on average, with an average rank of 5.56.
- The small Qwen model, run on the authors' own computer, also ranked CORE first most often, but only for 23.8% of brands, and it barely separated the six versions.
- For a brand, the result means that a lab test using a single model can point in the opposite direction from the AI search engines that customers use.
We also compared each version's average rank on the three AI search engines.
| AI search engine | Original | CORE | C-SEO | E-GEO | AgenticGEO | Statistics Addition |
|---|---|---|---|---|---|---|
| ChatGPT | 5.28 | 1.74 | 4.05 | 2.96 | 3.80 | 3.18 |
| Grok | 5.84 | 2.21 | 3.00 | 3.01 | 3.63 | 3.31 |
| Gemini | 4.88 | 2.01 | 3.46 | 3.25 | 3.58 | 3.83 |
Key Findings
- The Original page had the worst average rank on all three engines, from 4.88 on Gemini to 5.84 on Grok, so every rewrite beat the plain template text on average.
- Behind CORE, the order of the other four methods changed from engine to engine. E-GEO was second on ChatGPT with 2.96, C-SEO was second on Grok with 3.00, and E-GEO was second on Gemini with 3.25.
- For a brand, leaving a plain page that lists only specifications was the weakest choice on all three engines in this test.
How Often the AI Engines Agreed
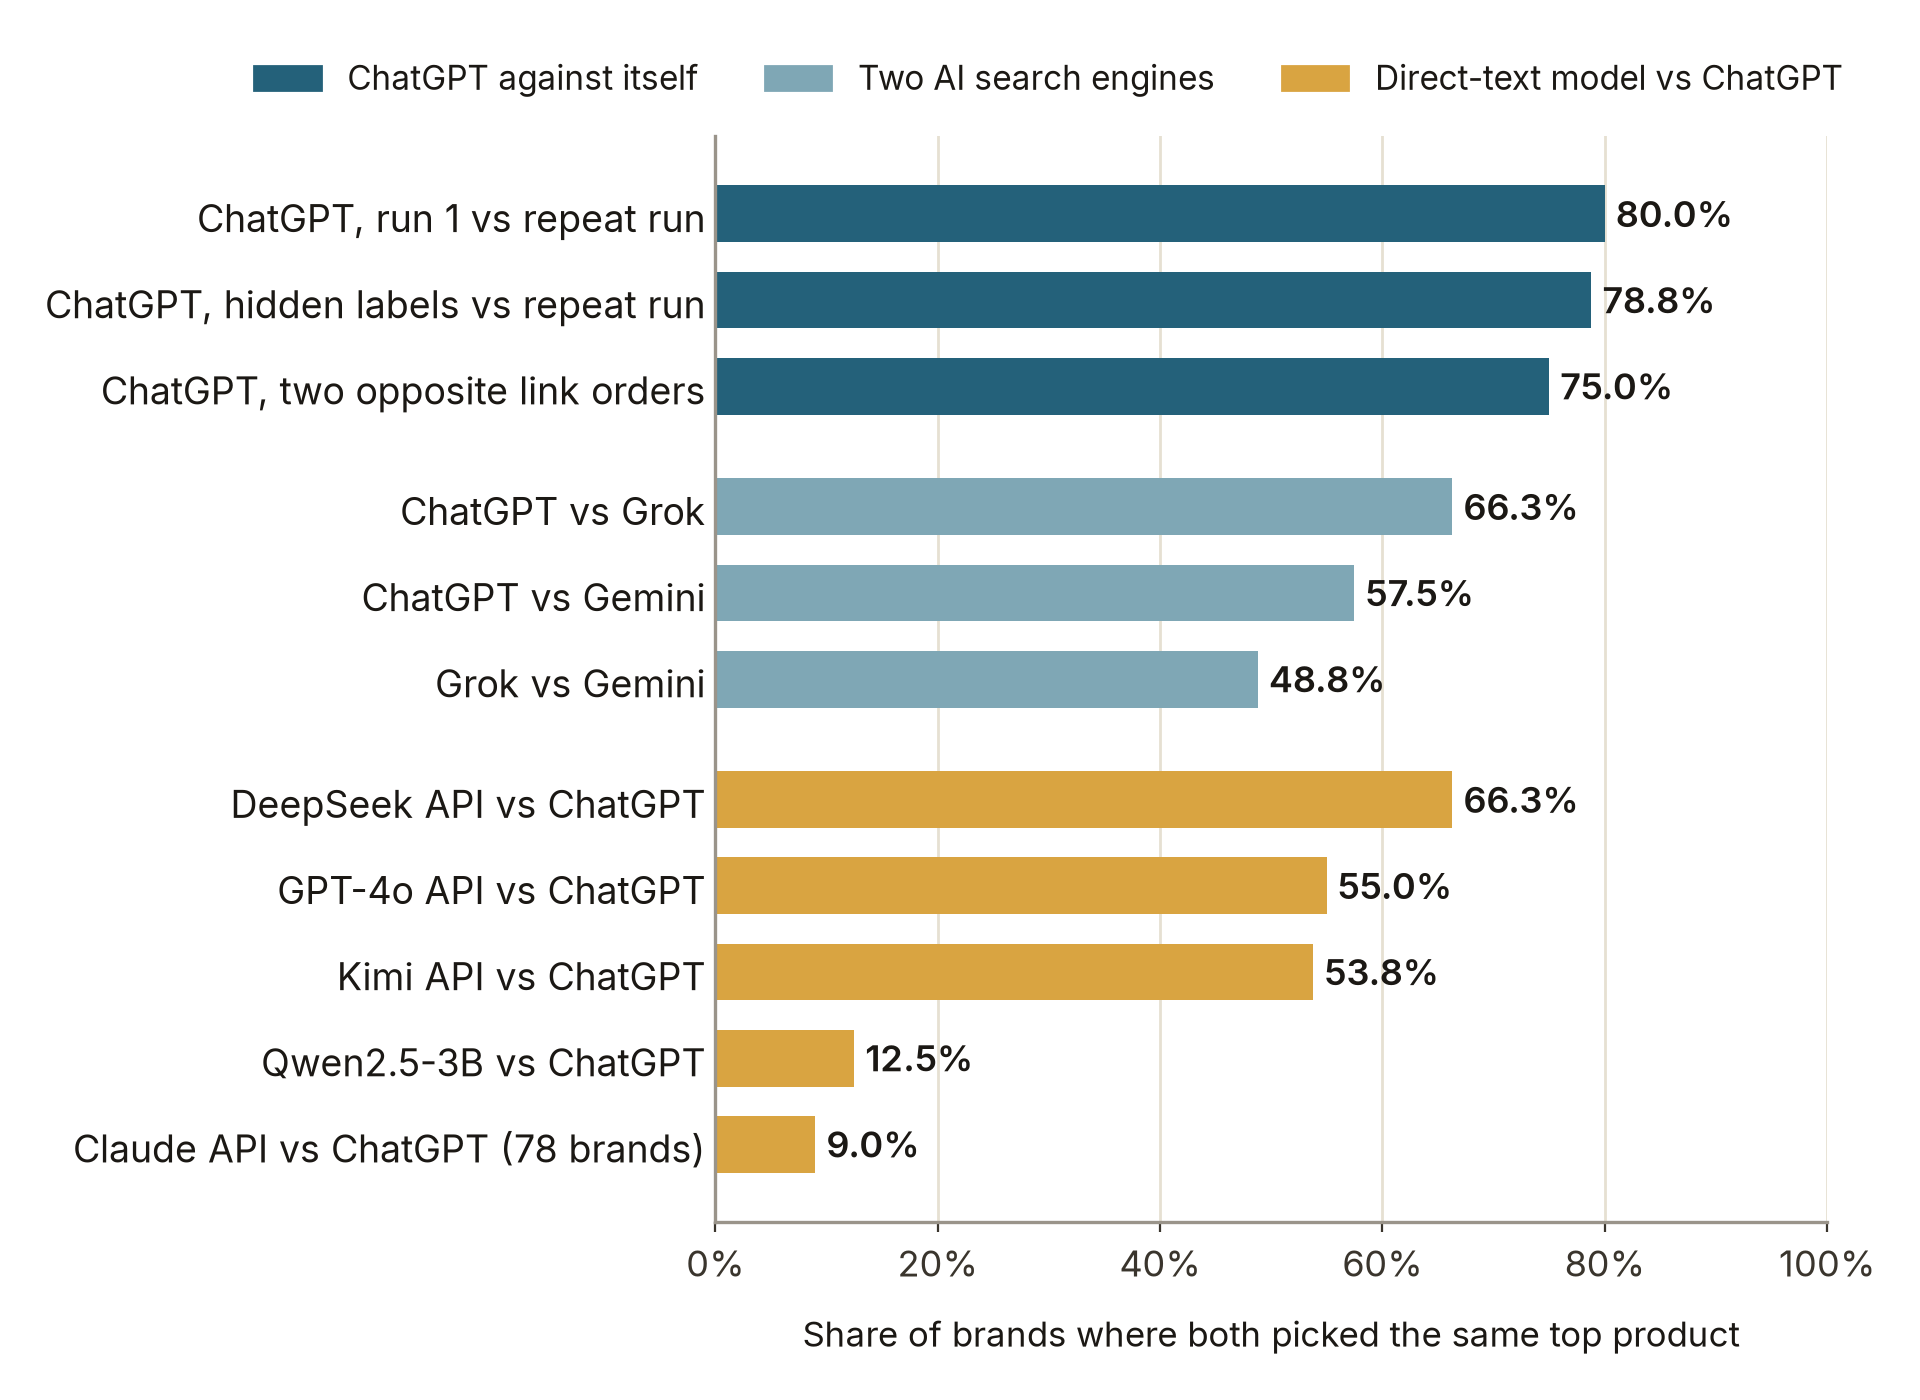
A method can win on average and still lose for many individual brands, so the authors checked how often two evaluators picked the same top product for the same brand. We compared ChatGPT with itself, the engines with each other, and the direct-text models with ChatGPT.
Key Findings
- Running ChatGPT again with the same pages, instructions, and link order produced the same top product for 80.0% of brands and the same last product for 90.0%, so repeat runs were fairly stable.
- The three engines agreed with each other much less. Each pair picked the same top product for between 48.8% and 66.3% of brands. For the thaw-bed planter, for example, Grok chose the Statistics Addition version and Gemini chose CORE.
- DeepSeek matched ChatGPT about as often as the engines matched each other, at 66.3%. Claude matched ChatGPT on only 9.0% of brands, and its rankings tended to run opposite to those of all three engines.
- Checking one AI engine tells a brand little about the others for any single product, so tracking visibility on each engine separately gives a truer picture.
How the Order of the Links Changed the Results
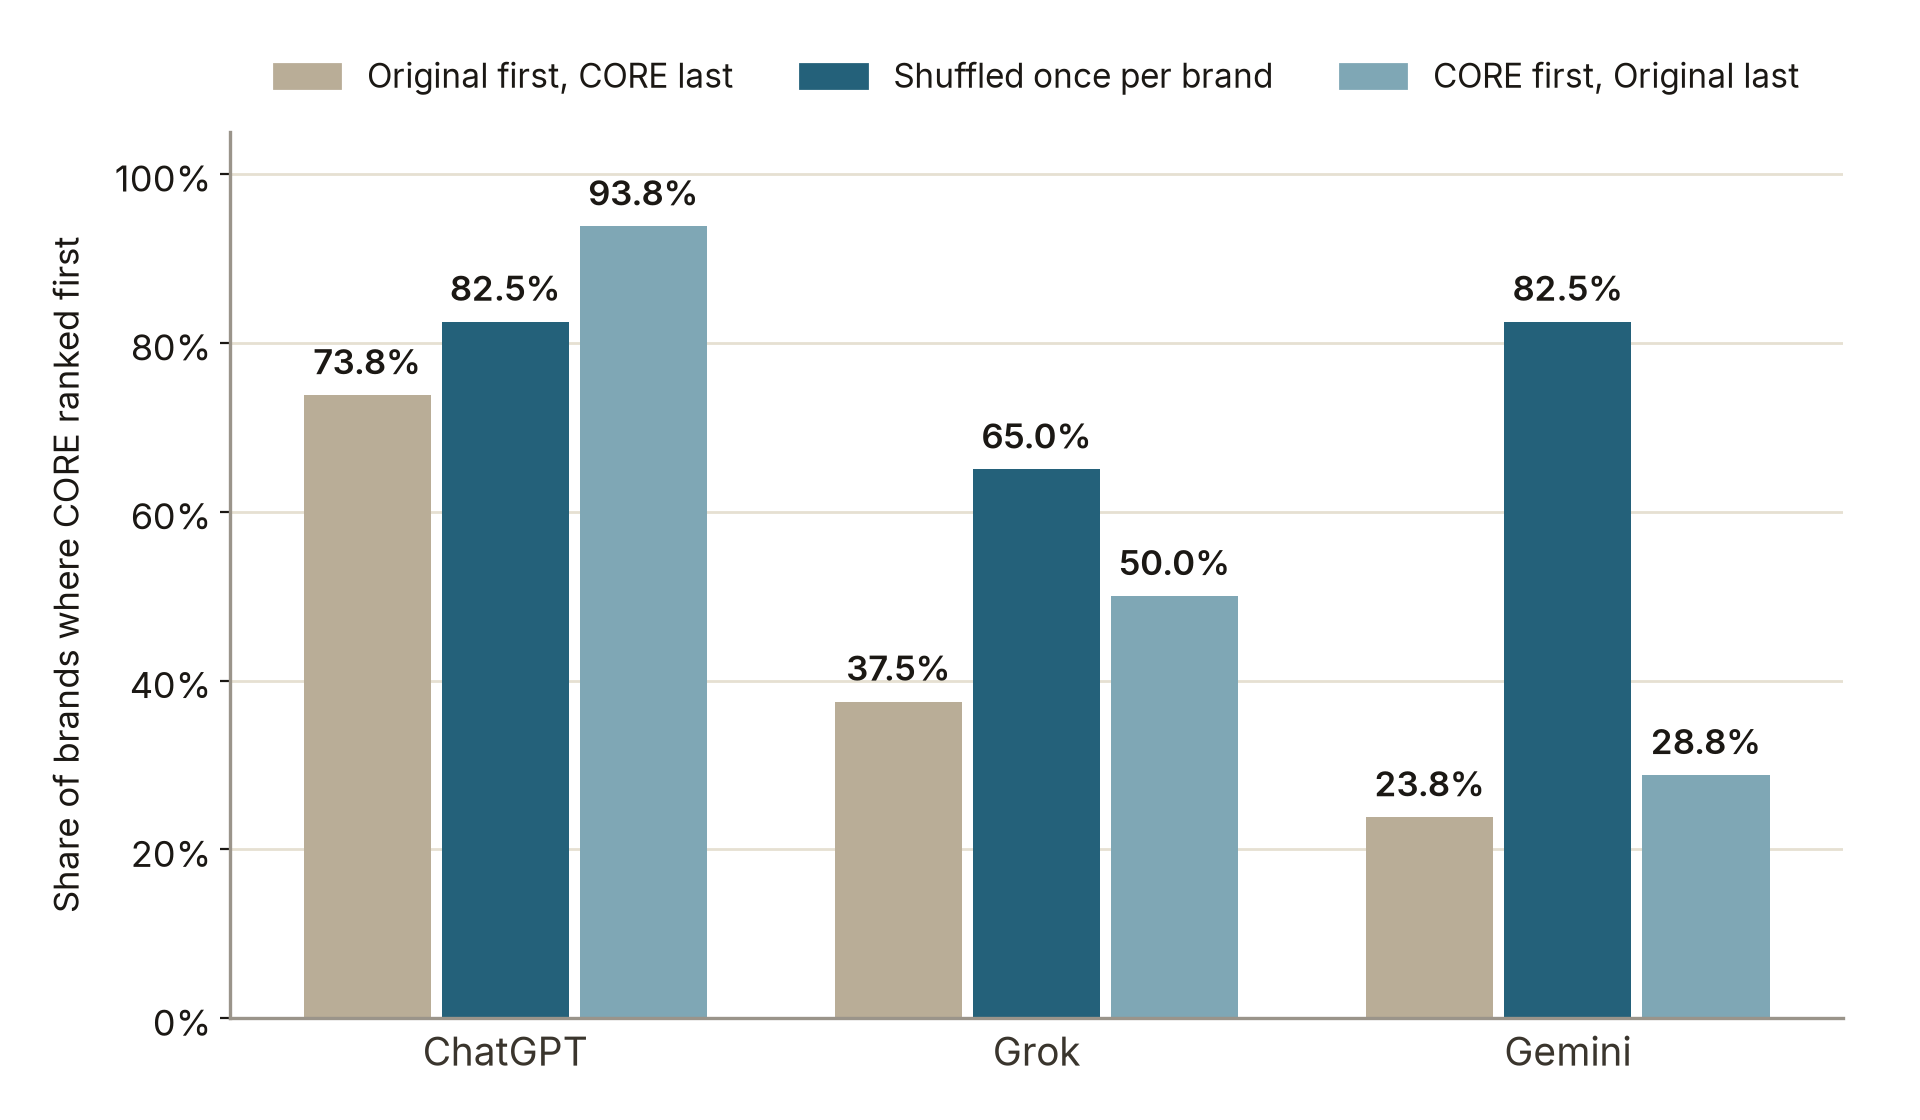
Next the authors gave the same six links in two fixed orders that were exact opposites. One put the Original first and CORE last. The other put CORE first and the Original last. All prices were equal in this test. We compared CORE's first-place rate under both orders and under the shuffled order used in the main test.
Key Findings
- On ChatGPT, CORE was ranked first for 73.8% of brands when its link came last and 93.8% when its link came first, a gap of 20 percentage points. The shuffled order fell between the two, at 82.5%.
- On Gemini, both fixed orders cut CORE's first-place rate sharply, to 23.8% and 28.8%, against 82.5% with the shuffled order. With the Original first, E-GEO took the most first places on Gemini, at 30.0%.
- On Grok, CORE was first for 37.5% of brands with its link last and 50.0% with its link first.
- The models that read the text directly were sensitive to order too. When the authors reversed the order of the six products, DeepSeek, Kimi, and Claude kept the same top product for between 43.6% and 72.5% of brands.
The engines also saw each version's method in its product name, such as a product called Sundrel Frame 13 CORE. In one run, the authors replaced the six labels with neutral made-up labels everywhere they appeared, including the page text, the web addresses, and the site's links.
| ChatGPT test condition | CORE ranked first | CORE average rank | Strongest other version |
|---|---|---|---|
| Product links, prices within 0.2% | 76.3% | 1.74 | Statistics Addition, 10.0% |
| Product links, equal prices, shuffled order | 82.5% | 1.46 | E-GEO, 10.0% |
| Same as above, repeated | 83.8% | 1.41 | Statistics Addition, 12.5% |
| Equal prices, Original first and CORE last | 73.8% | 1.95 | E-GEO, 13.8% |
| Equal prices, CORE first and Original last | 93.8% | 1.16 | E-GEO, 3.8% |
| Equal prices, version labels hidden | 76.3% | 1.58 | Statistics Addition, 21.3% |
| Brand page link, equal prices | 53.8% | 2.69 | E-GEO, 26.3% |
| Brand page link, prices within 0.2% | 46.3% | 2.45 | Statistics Addition, 13.8% |
Key Findings
- Hiding the labels lowered CORE's first-place rate from 83.8% in the repeat run to 76.3% and raised Statistics Addition's from 12.5% to 21.3%.
- Even with the labels hidden, ChatGPT picked the same top product as in the labeled repeat run for 78.8% of brands.
- A ranking result belongs to the exact way the pages were presented, so a gain measured under one order or one set of labels may not hold under another.
How Prices and Page Access Affected Rankings
The authors also checked whether tiny price differences or a different way of reaching the pages would change the winner.
- Moving from equal prices to prices within 0.2% of each other changed CORE's first-place rate from 82.5% to 76.3% on ChatGPT, from 65.0% to 67.5% on Grok, and from 82.5% to 66.3% on Gemini. CORE stayed first on all three.
- With the small price differences, the Original's average rank on ChatGPT improved by 0.59 places and E-GEO's fell by 0.54. On Gemini, CORE's average rank fell by 0.63 and AgenticGEO's improved by 0.33.
- With prices within 0.2%, when ChatGPT received the brand page and had to find the products itself, CORE ranked first for 46.3% of brands, against 76.3% with direct product links. On Grok, the two ways of reaching the pages gave similar results, 71.3% and 67.5%.
- With the brand page link and equal prices, E-GEO had the best average rank on ChatGPT, 2.28 against CORE's 2.69, even though CORE still took the most first places.
What Happened to Rewrites That Made Up Numbers
Before publishing each rewrite, the authors ran every rewritten description through a verification model called JEV, which checks whether the numbers in the text match the product's specifications. A description fails when it contradicts a specification or adds a number the specifications do not support. Flagged pages stayed on the site unchanged, and the flags were recorded separately.
JEV flagged 86 of the 400 rewritten descriptions. All 80 Statistics Addition descriptions were flagged, because that method's instructions ask for persuasive statistics and allow made-up figures, which produced claims such as an "18% improvement in heat retention." Six other descriptions were flagged as well, including CORE's claim of "30% energy savings" and AgenticGEO's claim of "up to 60% less water use." To test the checker, the authors ran it on 194 test cases from three public fact-checking datasets.
| Test set | Cases | Correct | Missed problems | False alarms |
|---|---|---|---|---|
| SciTab | 24 | 91.7% | 1 | 1 |
| TabFact | 85 | 92.9% | 4 | 2 |
| FEVEROUS | 85 | 88.2% | 8 | 2 |
| All three | 194 | 90.7% | 13 | 5 |
Key Findings
- JEV judged 176 of the 194 test cases correctly, or 90.7%. Three human reviewers also read 50 randomly chosen descriptions, ten from each method, without seeing JEV's results, and JEV agreed with the majority view on all 50.
- When the authors moved every flagged product below the unflagged ones, Statistics Addition lost every first place it had won, in every condition. At equal prices, CORE's first-place rate on ChatGPT rose from 82.5% to 86.3%.
- In this study, rankings won with figures a product cannot support disappeared as soon as someone checked the figures against the specifications.
Limits to Keep in Mind
- Every brand and product was invented, in unusual categories with no real competitors. The AI engines ranked six versions of the same product against each other, not a brand's page against other companies' pages.
- The engines were handed the links to the pages. The test measured how engines rank pages they open, not whether an engine's own search would find those pages for a real customer's question.
- CORE received ChatGPT's rankings as feedback before its text was frozen, which no other method did, and in most runs each product name showed which method wrote it.
- Each condition used one fixed set of instructions and one form of question, and the results come from one frozen set of pages. The authors present the public site as the way to add more methods and more measurements over time.
What This Means for Brands in 2027 and Beyond
For brands, the clearest result is that rewriting a plain product page helped on every AI search engine tested, and that a method built from ranking feedback came out ahead across all three engines. The less comfortable result is that the engines disagreed about the winner for a third to a half of the brands, and a model that read the text directly could rank the same pages in the opposite order. A visibility gain measured on one model, one order of links, or one engine is a weak guide to what customers will see on the others.
The study also shows the risk of invented figures. Statistics Addition won its first places by adding numbers the products could not support, and it lost all of them once those numbers were checked against the specifications. Our report on the competitive GEO paper found a related pattern, where concrete facts such as prices and specifications decided which of two pages an AI model cited. Brands that want help testing their pages across several AI engines can compare specialist firms in our directory of GEO and AEO agencies.
So if you rewrite product pages for AI search, measure the results on each engine your customers use, with the pages live on the web, and keep every number tied to a real specification.
Data Collection and Methodology
We read the arXiv version of the paper (2611.01126v1, posted October 31, 2026) and took every figure in this article from the paper's text and tables.
First-place rates, average ranks, and the strongest other version in each condition come from the paper's table of results for every evaluator and condition. Agreement between evaluators comes from the paper's ranking agreement table, and the JEV accuracy figures come from its verification table, with percentages rounded once to one decimal place. Changes in average rank come from the paper's table of paired comparisons, and we report only the changes the paper shows as clearly different from zero. Claude API figures cover the 78 brands it agreed to rank. First-place rates in a row can add to slightly more than 100% because the paper rounds each one separately.
Sources
- Top GEO Agencies, The LIVE-GEO Paper, Explained, November 2026, New York, New York. Download the data (CSV).
- Do GEO Gains Survive the Live Web? Evaluating In-the-Wild Visibility Gains of Generative Engine Optimization via LIVE-GEO. Runze Kong, Haibo Jin, Xucheng Yu, Xiaoqi Wang, Huimin Zeng, and Haohan Wang. University of Michigan, University of Illinois Urbana-Champaign, and Starc Institute. arXiv 2611.01126, October 2026. PDF.
- Controlling Output Rankings in LLM-Based Search via Generative Engine Optimization. Haibo Jin and co-authors. arXiv 2602.03608, February 2026.